
-
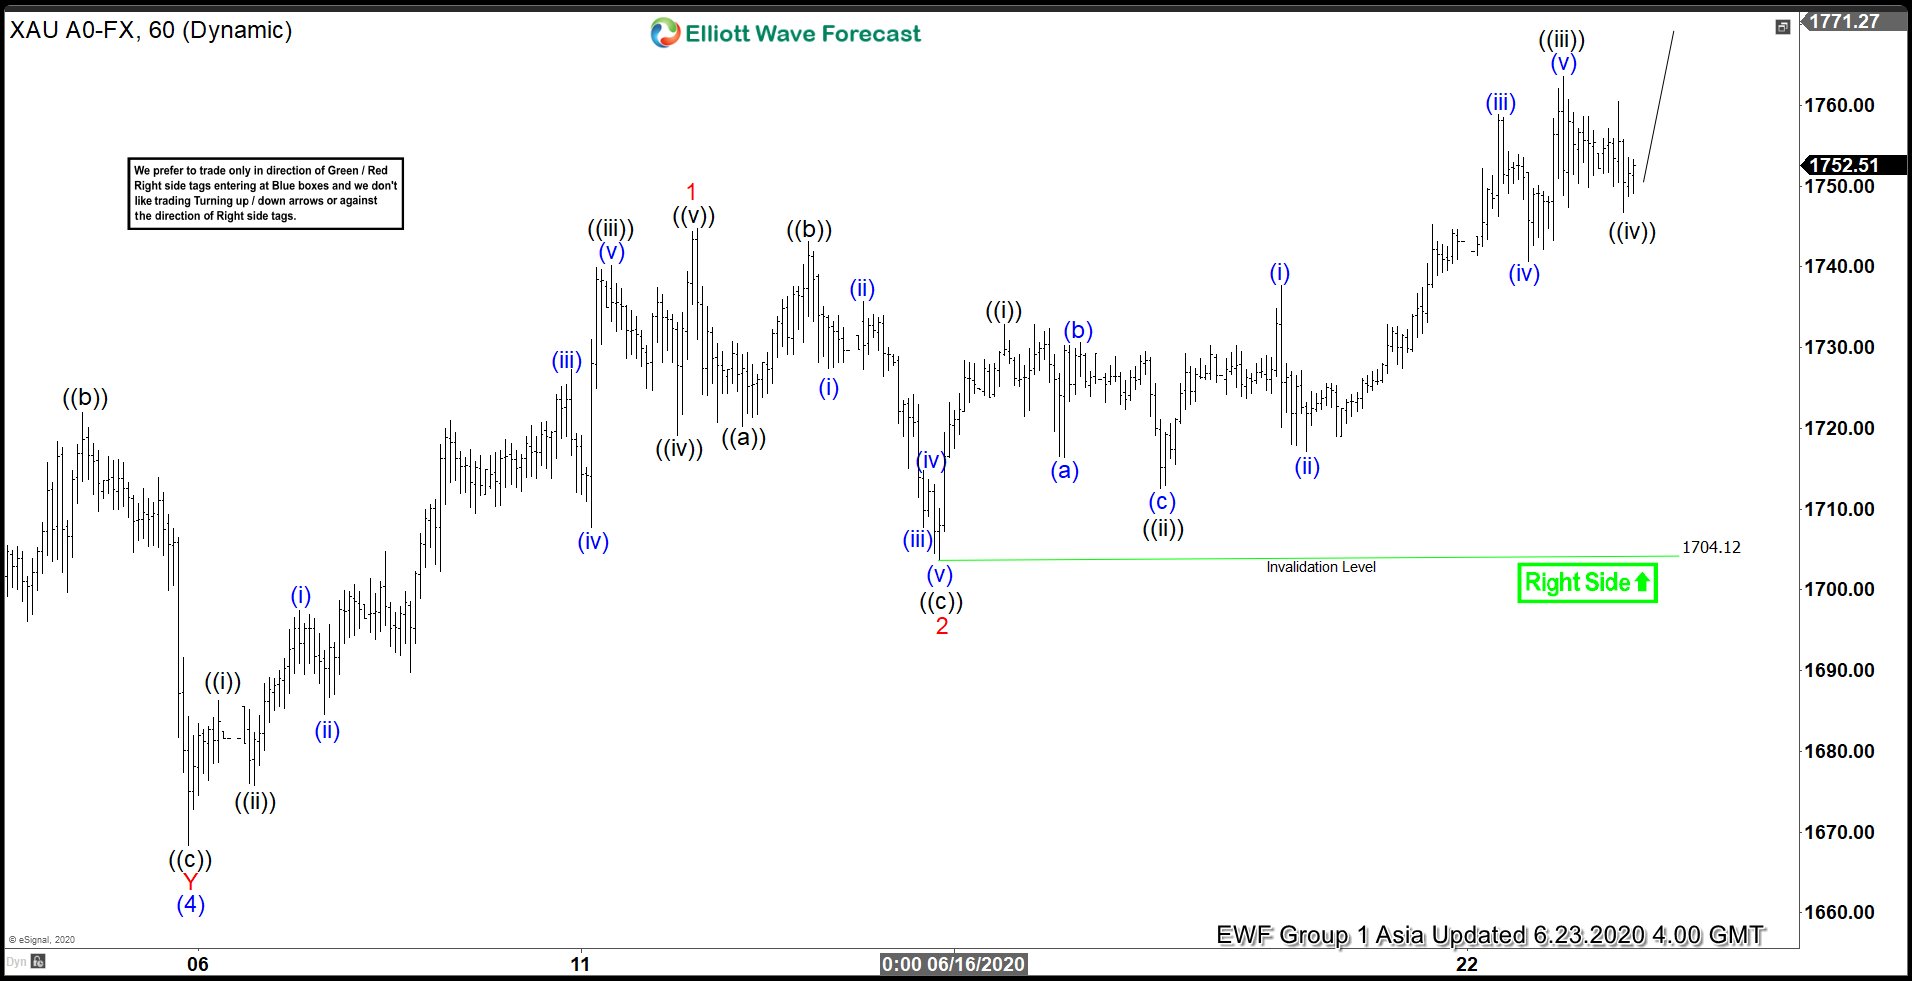
Elliott Wave View: Gold Extends Higher
Read MoreGold shows higher high sequence from 6.5.2020 low. While above 6.15.2020 low, expect the dips in 3,7,11 swings to find support and gold to extend higher.
-
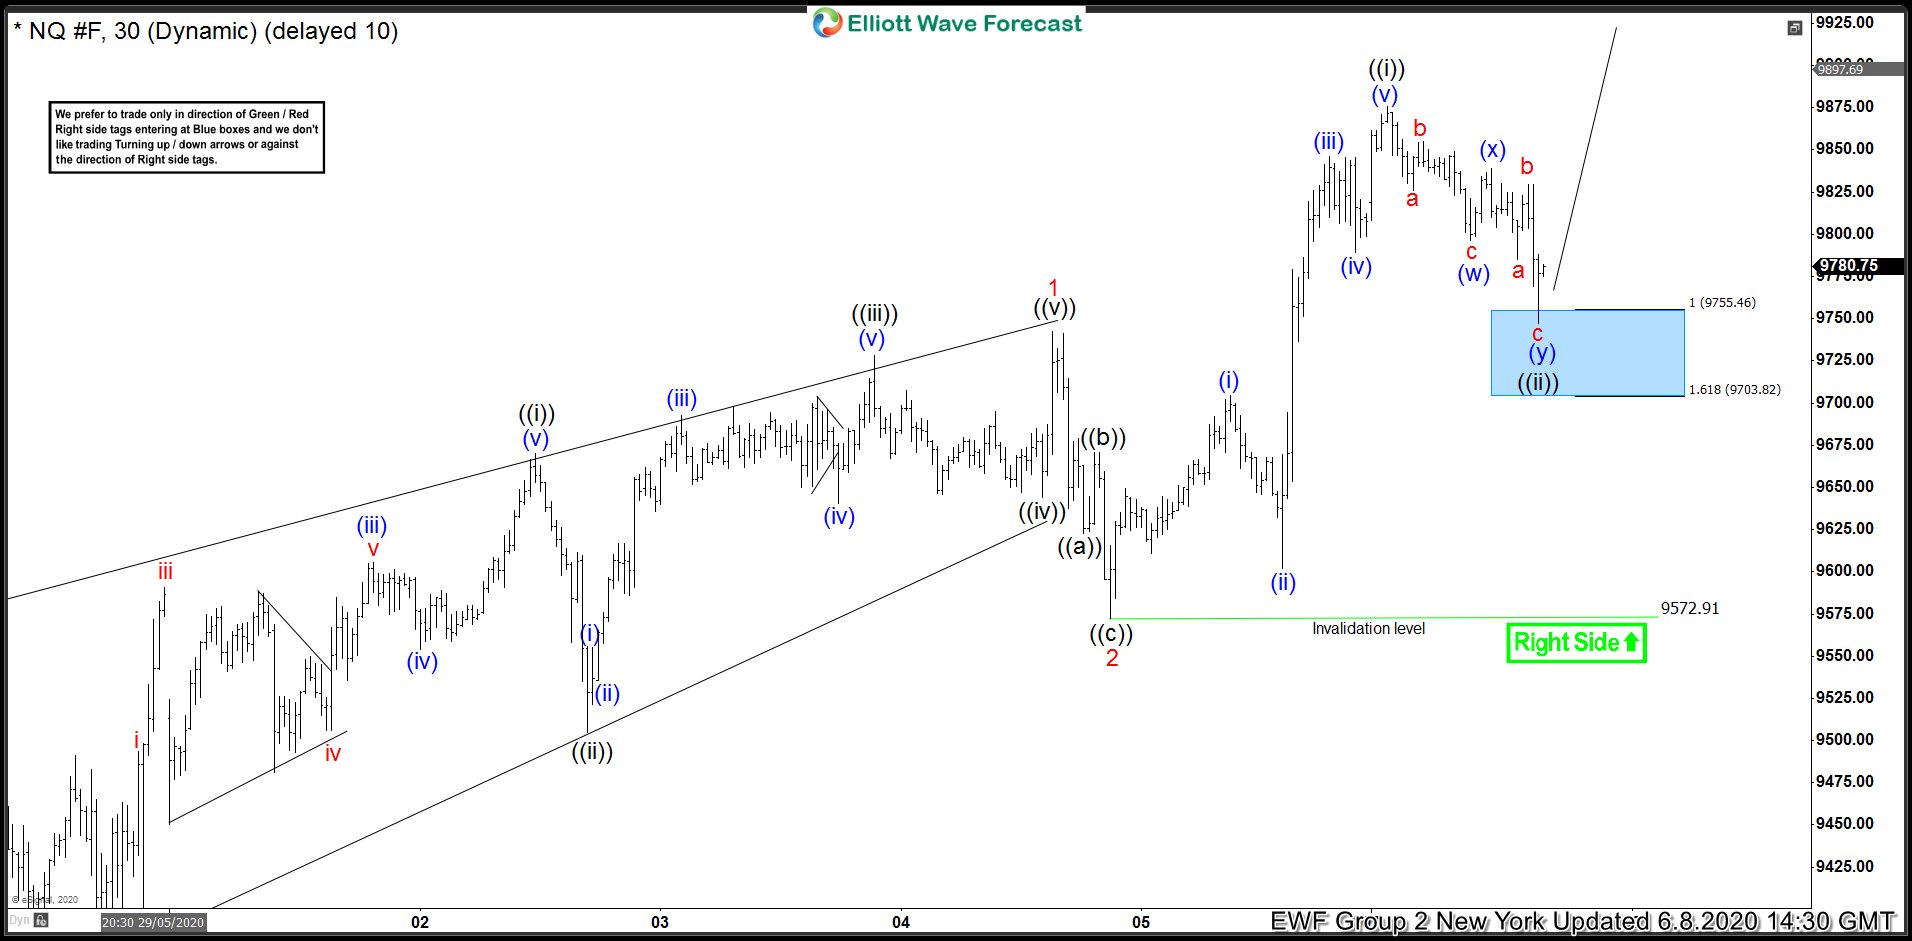
NASDAQ (NQ_F) Bounced Higher From Blue Box To All Time High
Read MoreIn this blog, we are going to take a look at the Elliott Wave chart of NASDAQ Futures (NQ_F). The 1 hour London chart update from June 8, 2020 shows that the index has ended the cycle from May 27 low at 9742.50 high. NASDAQ then did a pullback to correct that cycle, which ended […]
-
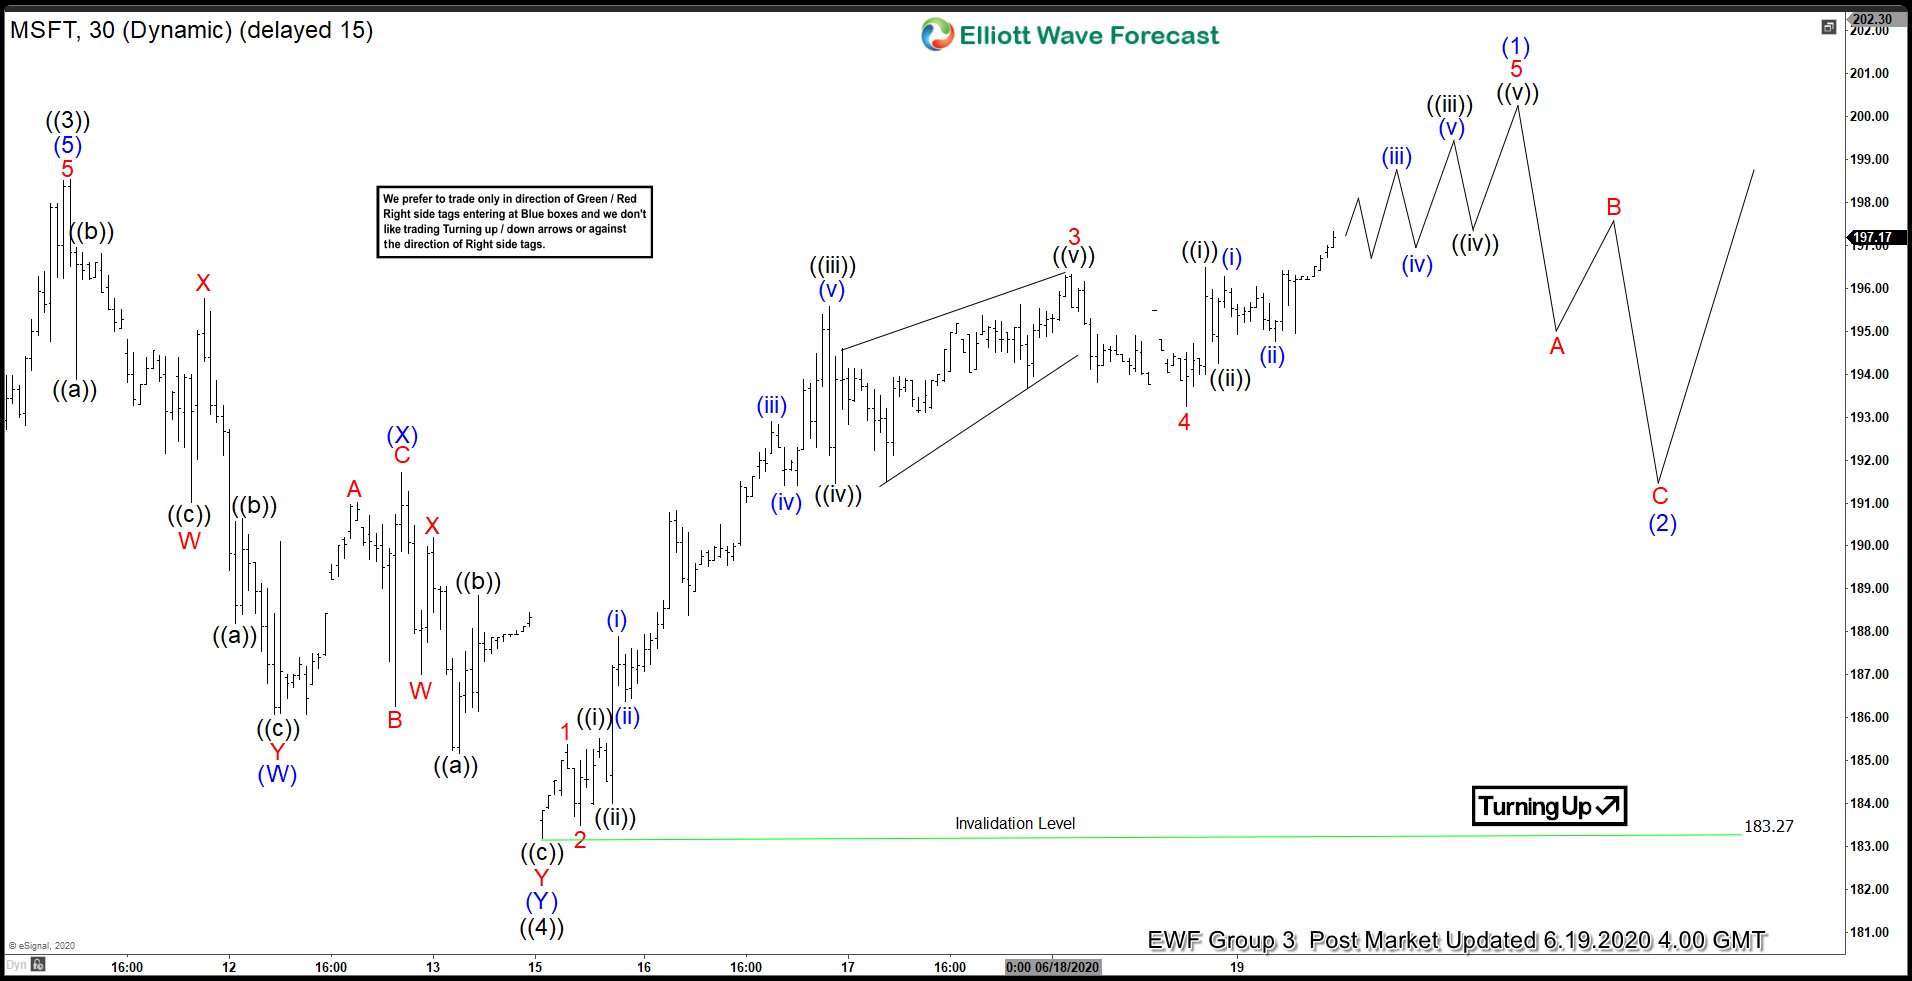
Elliott Wave View: Microsoft (MSFT) Cycle from March Low Still In Progress
Read MoreMicrosoft Corporation ( MSFT ) is currently still extending higher from 3.23.2020 low. The stock reached all time high on 6.11.2020 and ended wave ((3)) at 198.52 high. From there, MSFT did a pullback in wave ((4)) as a Double Three Elliott Wave structure. Down from 6.11.2020 high, wave (W) ended at 186.07 low. The […]
-
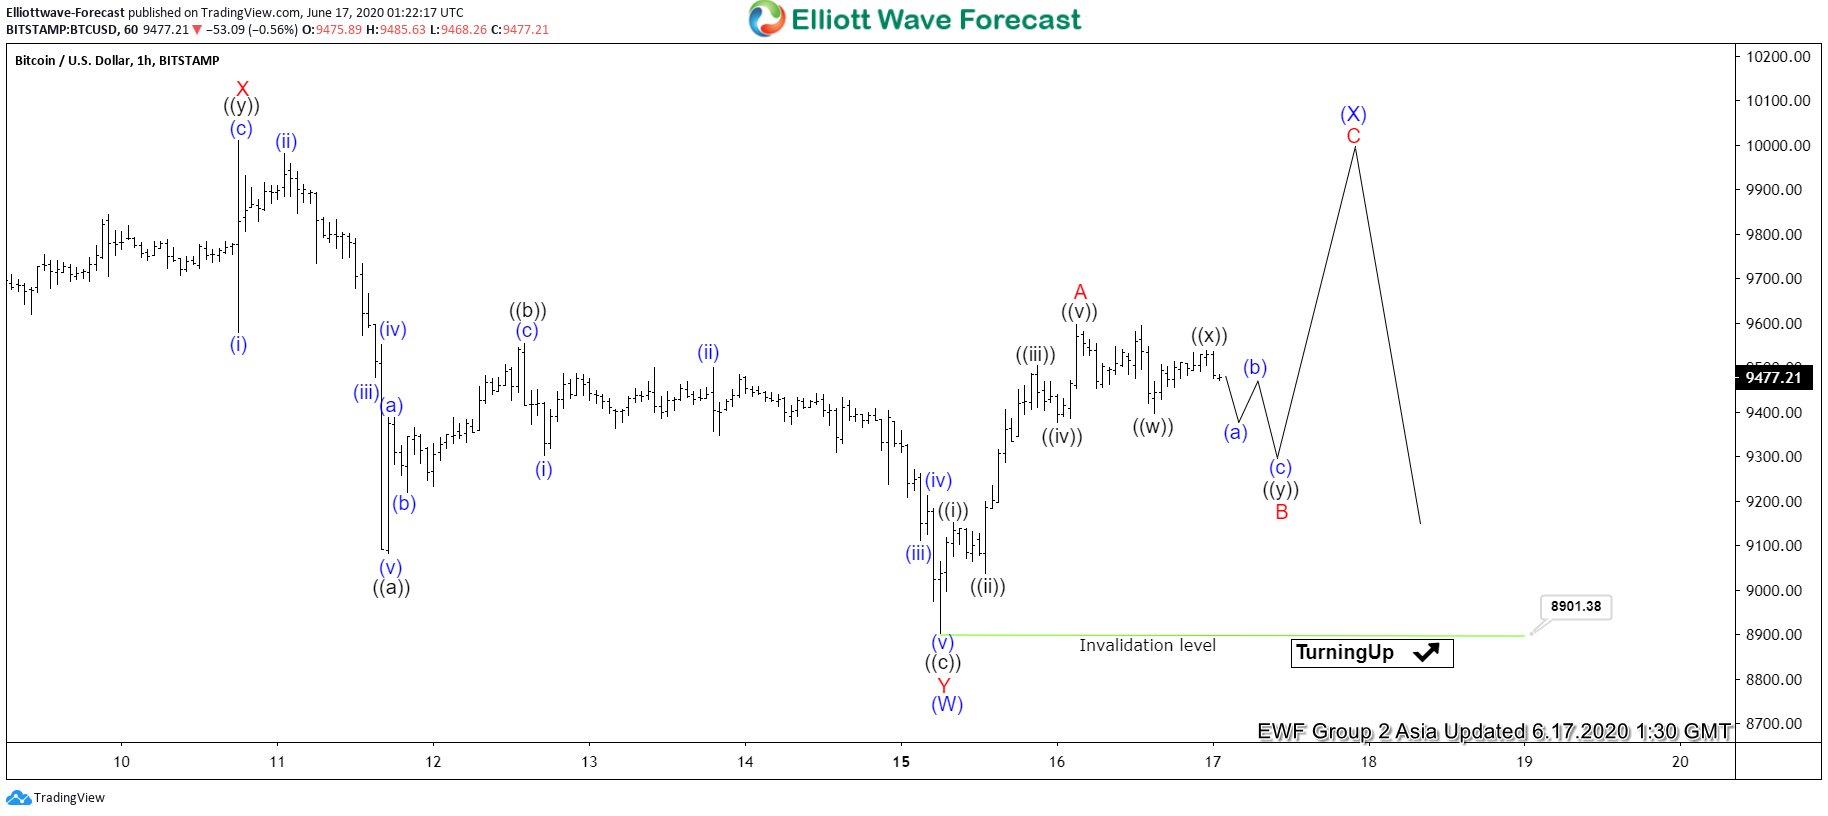
Elliott Wave View: Bitcoin shows short term impulse up
Read MoreBitcoin (BTC/USD) is currently correcting the cycle from 3.13.2020 low. The instrument has just ended cycle from 6.1.2020 high (10429) as a double three structure. Down from 6.1.2020 high, wave W ended at 9135 low. The bounce in wave X ended at 10011 high. From there, the instrument extended lower and ended wave Y at […]
-
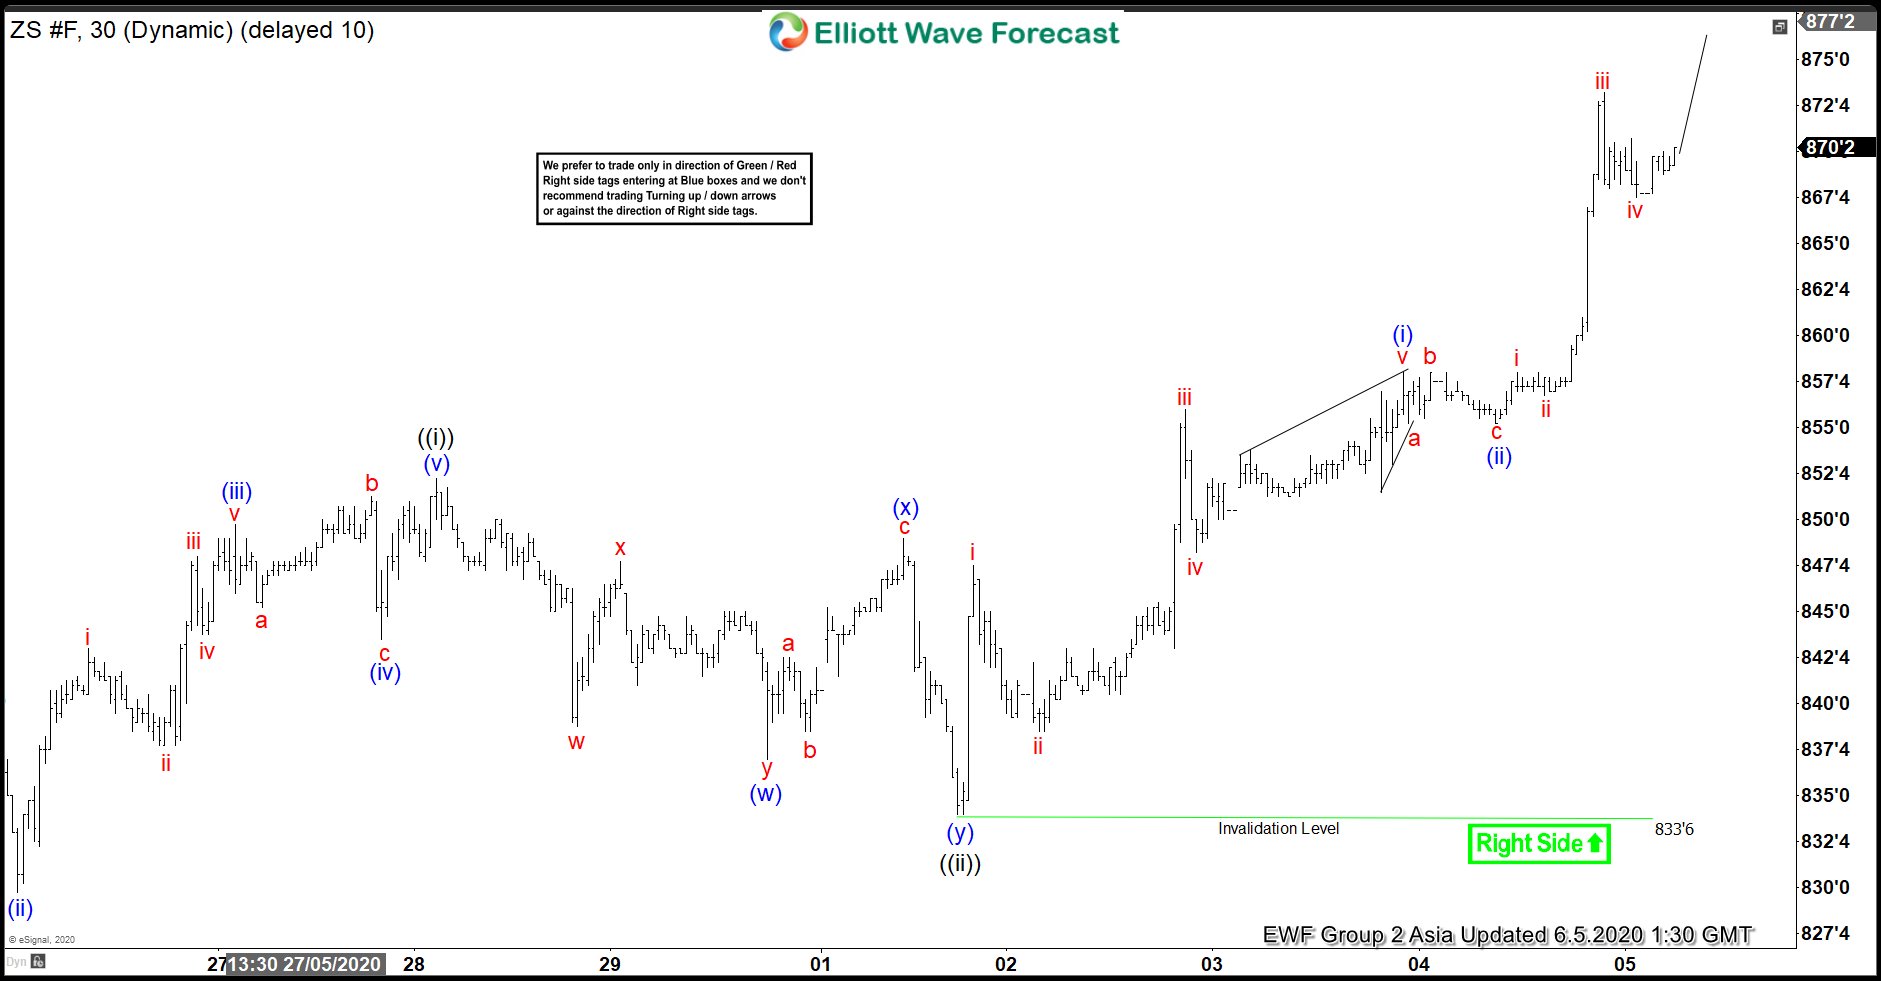
ZS_F (Soybean): Forecasting The Path Higher
Read MoreIn this blog, we are going to take a look at the Elliott Wave chart of ZS_F (Soybean Futures) and how we called it higher. The 1 hour London chart update from June 2 shows that Soybean has ended the cycle from May 22 low as wave ((i)) at 852.2 high. The sub-waves of the […]
-
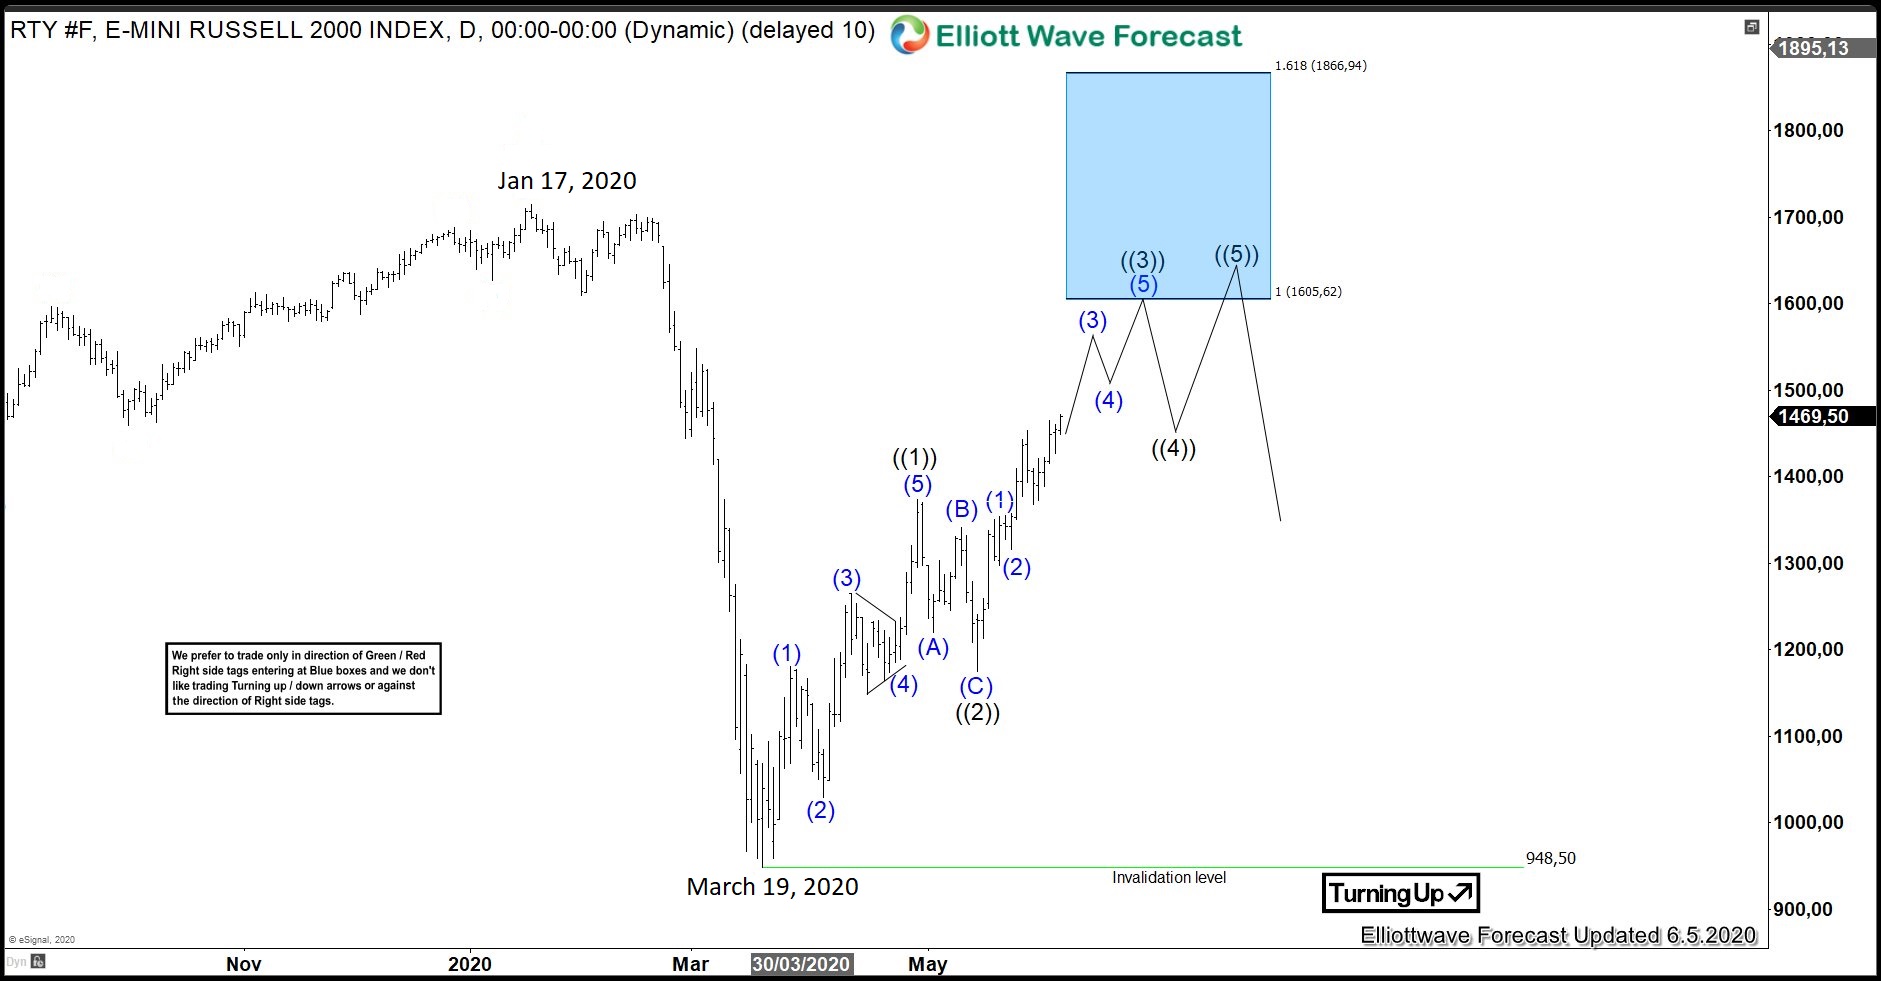
More Upside For RTY_F (Russell 2000) In The Near Term
Read MoreIn this blog, we are going to take a look at the Elliottwave chart of RTY_F. Daily chart below shows that RTY_F ended the decline from January 17, 2020 high at 948.50 low. Since reaching that March 19 low, the index has continued to extend higher. From 948 low, the index extended higher in wave […]