
-
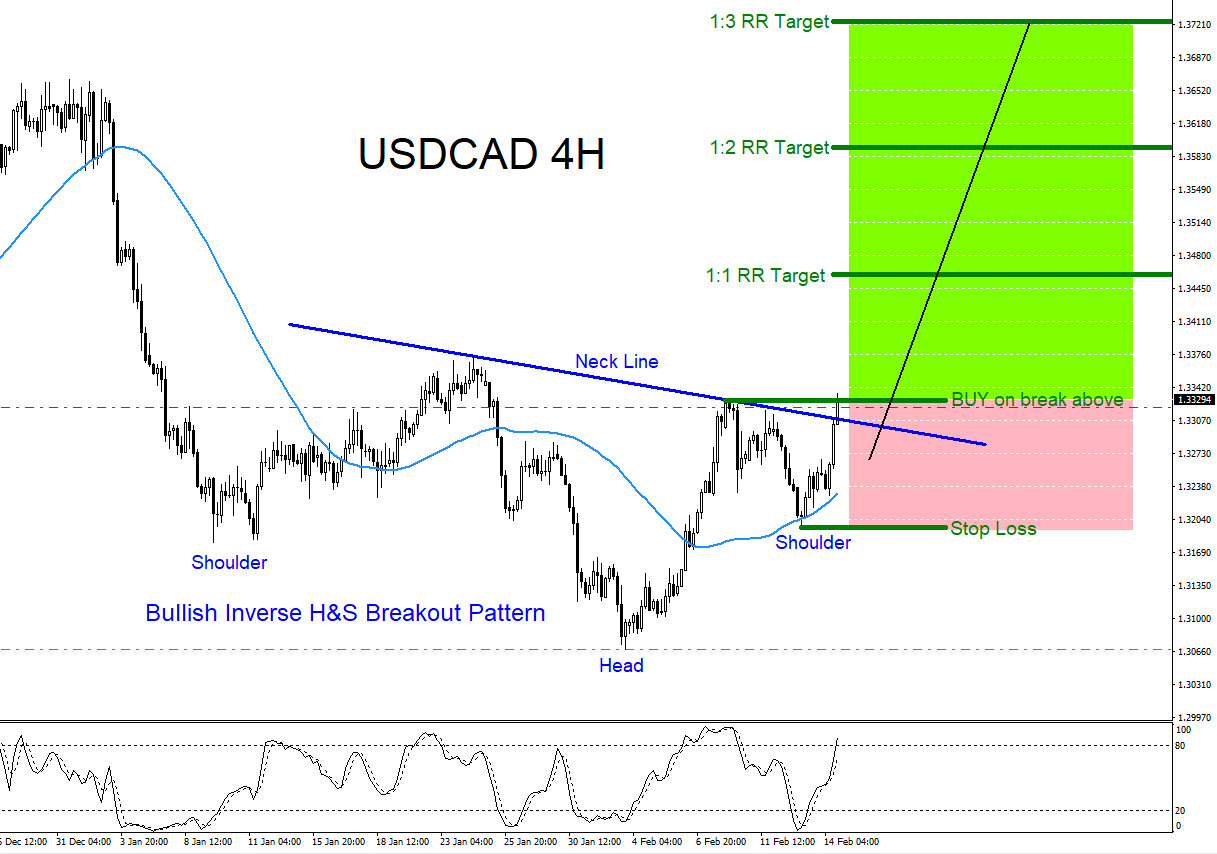
USDCAD : Possible Breakout Higher?
Read MoreUSDCAD Technical Analysis February 14/2019 USDCAD BUY/LONG Trade Setup: USDCAD is forming a bullish inverted Head and Shoulders market breakout pattern. Price has already broke above the neck line which can be a signal that possibly more bulls will be entering LONGS and will start pushing the pair higher. Traders should watch for a good […]
-
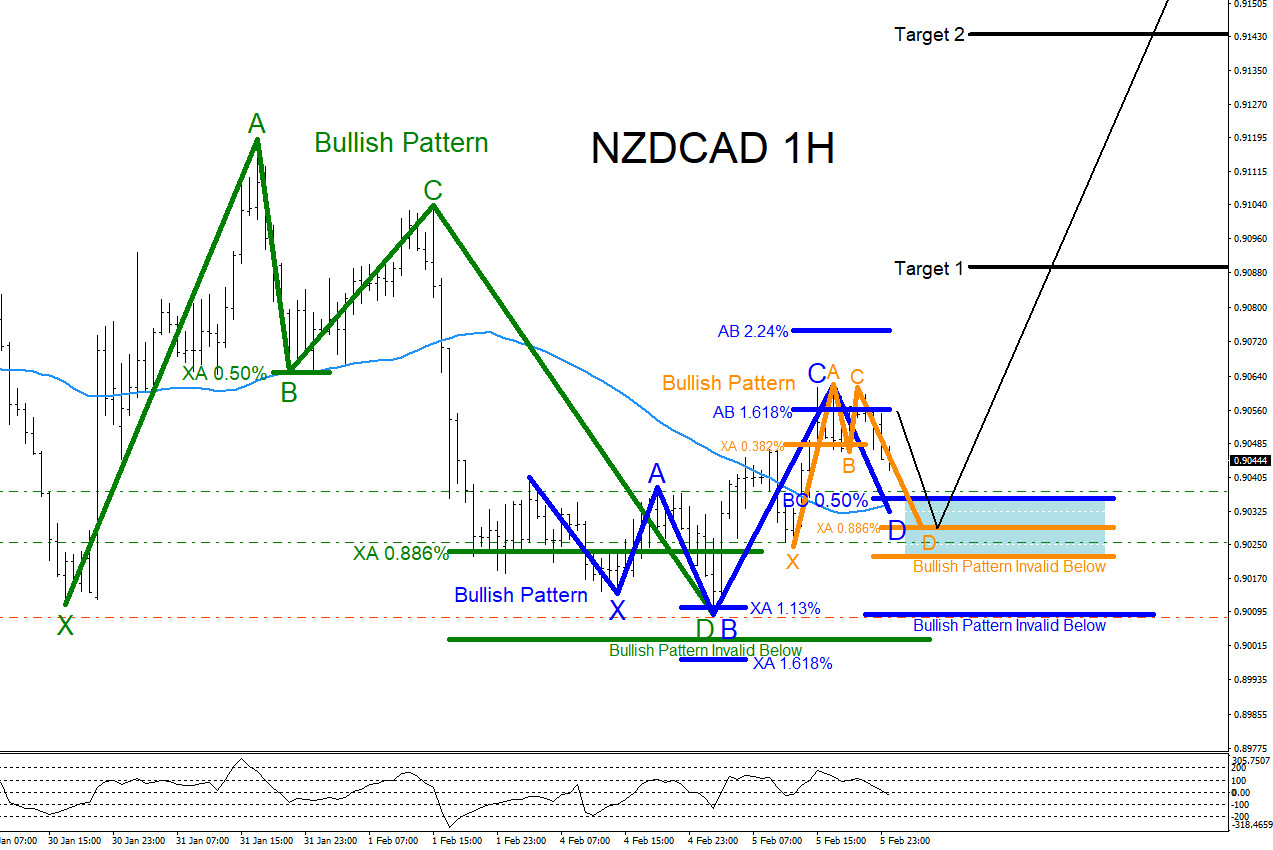
NZDCAD : Buy the Dip for Another Push Higher
Read MoreNZDCAD Technical Analysis February 5/2019 NZDCAD remains bullish as long as today’s low (0.9008) remains untouched. On the 1 hour chart there are clear visible bullish patterns that can be seen. In the chart below, market patterns are used to determine where price can possibly pause and reverse higher. The green bullish pattern has already […]
-
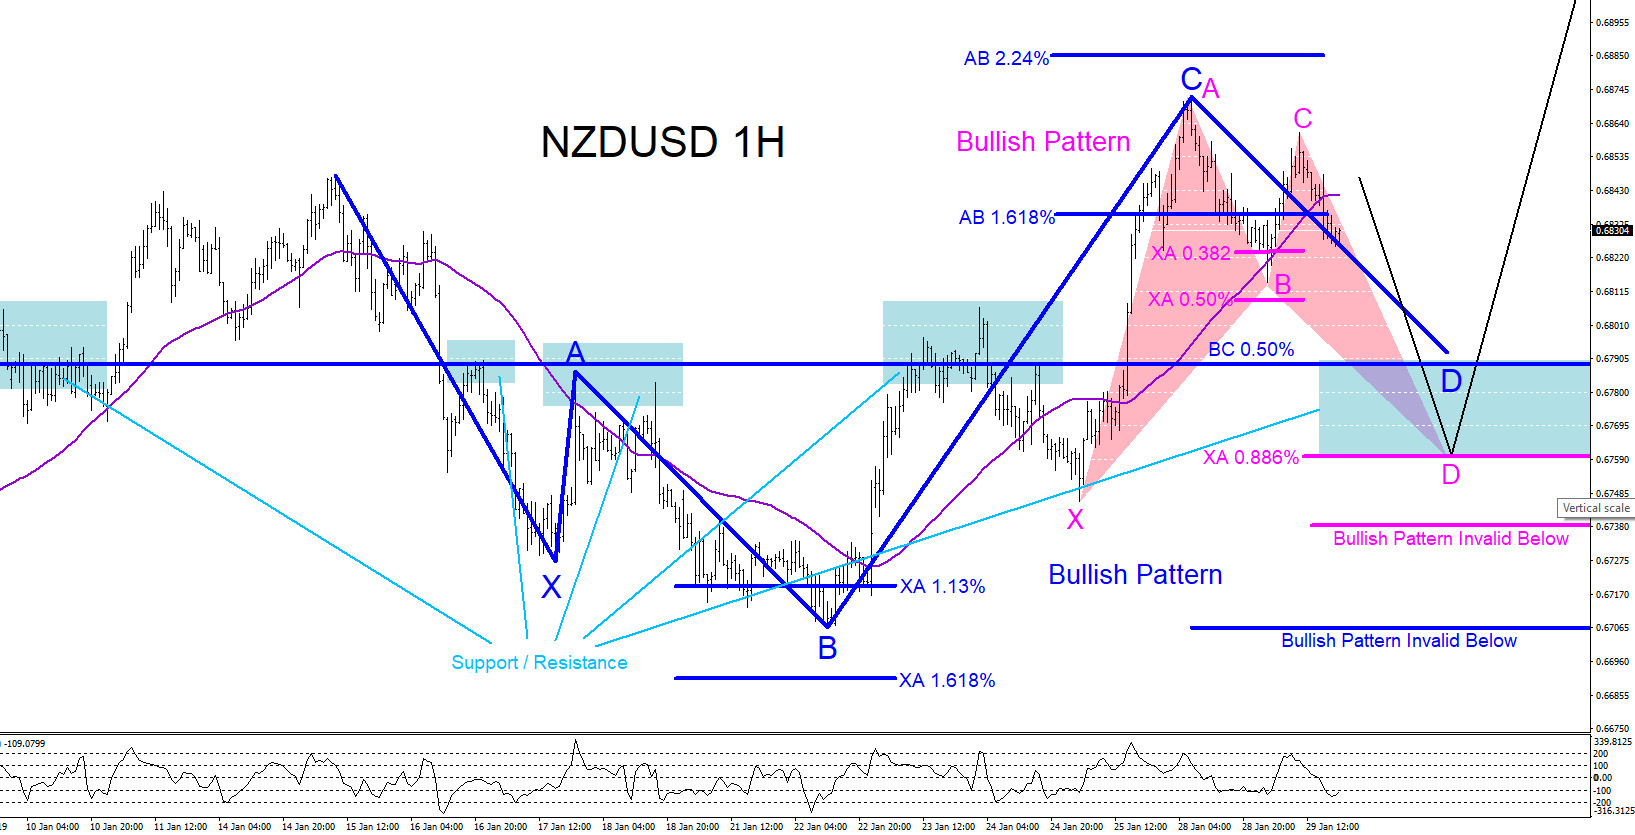
NZDUSD : Watch Reversal Zone for Another Move Higher
Read MoreNZDUSD Technical Analysis January 29/2019 NZDUSD remains bullish as long as the January 22/2019 low remains untouched. If you read the article, NZDUSD : Possible Bullish Patterns, published on December 19/2018 you will already know that we are only looking to BUY/LONG kiwi dollar. If you missed that move higher then there is another opportunity […]
-
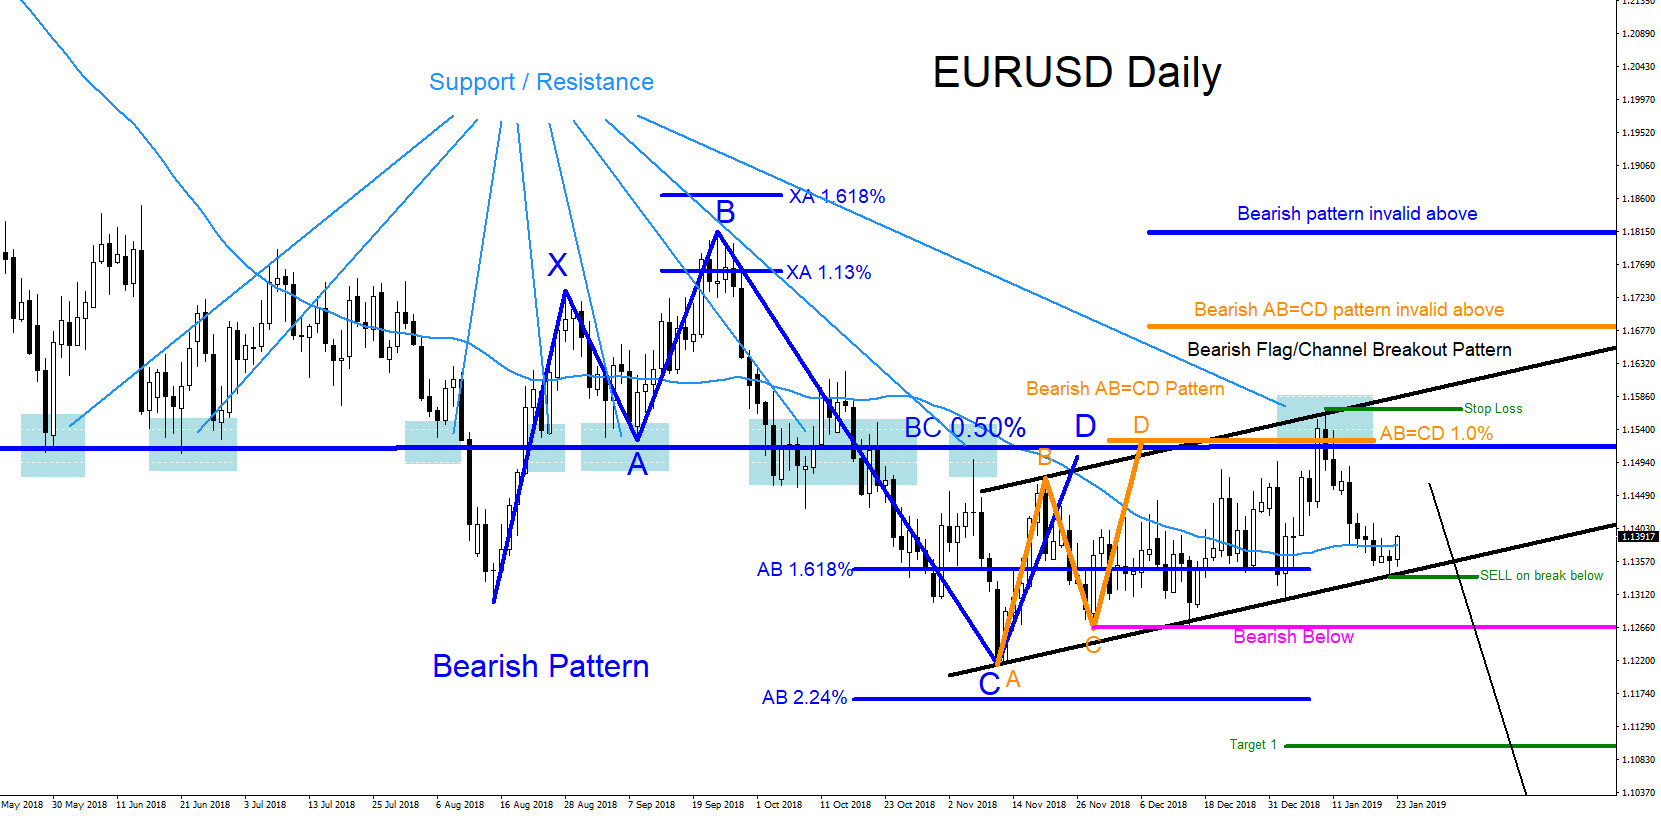
EURUSD : Will Pair Break Lower?
Read MoreEURUSD Technical Analysis January 23/2019 EURUSD : Bearish market patterns can be seen on the Daily chart. In the chart below there are bearish patterns that have already triggered SELLS. The blue bearish pattern triggered SELLS at the BC 0.50% Fib. retracement level and the orange bearish AB=CD pattern also triggered SELLS near the BC […]
-
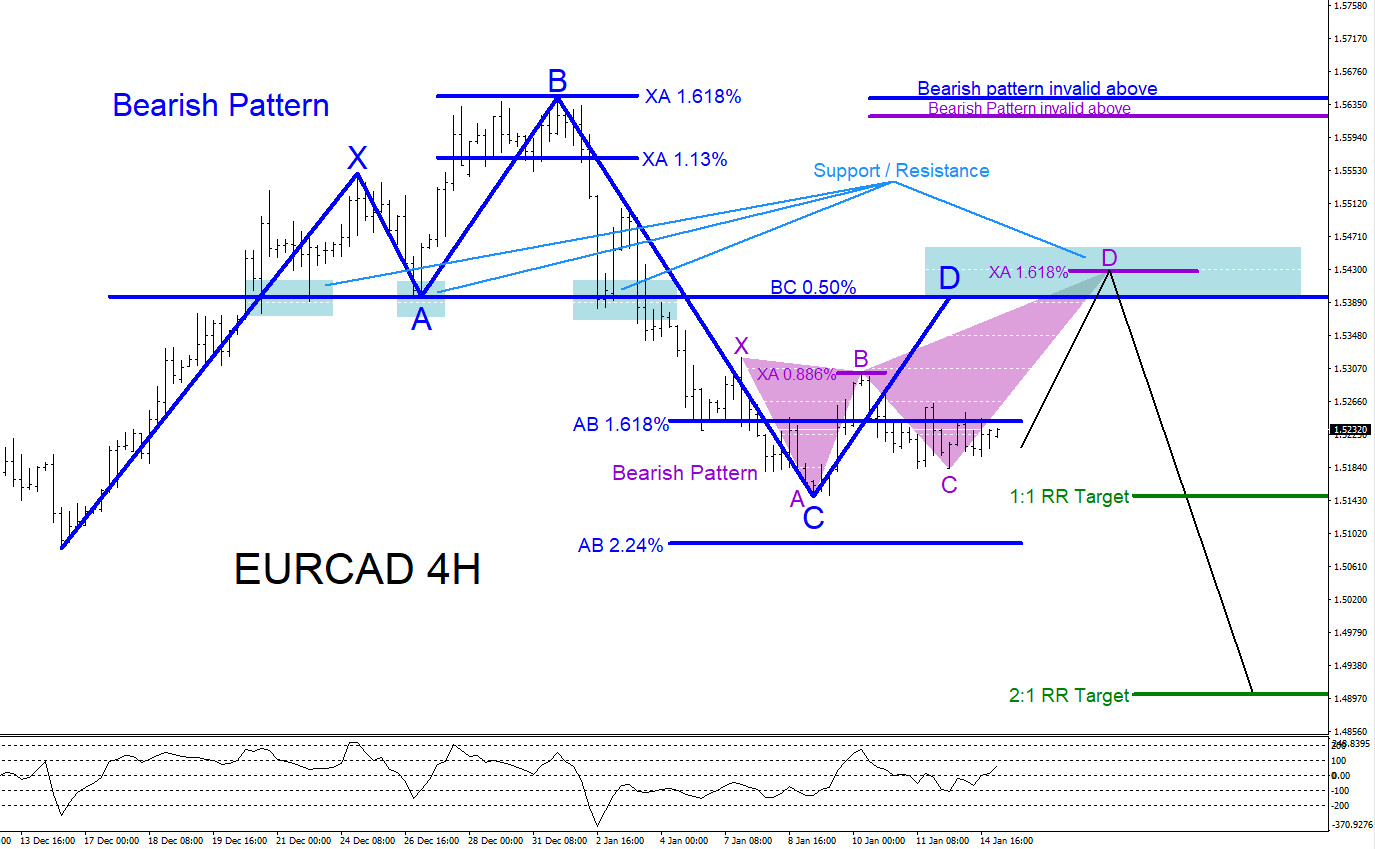
EURCAD : Will Bears Take Control?
Read MoreEURCAD Technical Analysis January 14/2019 Bearish market patterns can be seen on the EURCAD 4 hour chart. In the chart below there are possible bearish patterns that can trigger SELLS if the market makes another move higher. The blue bearish pattern triggers SELLS at the BC 0.50% Fib. retracement level and the purple bearish pattern […]
-
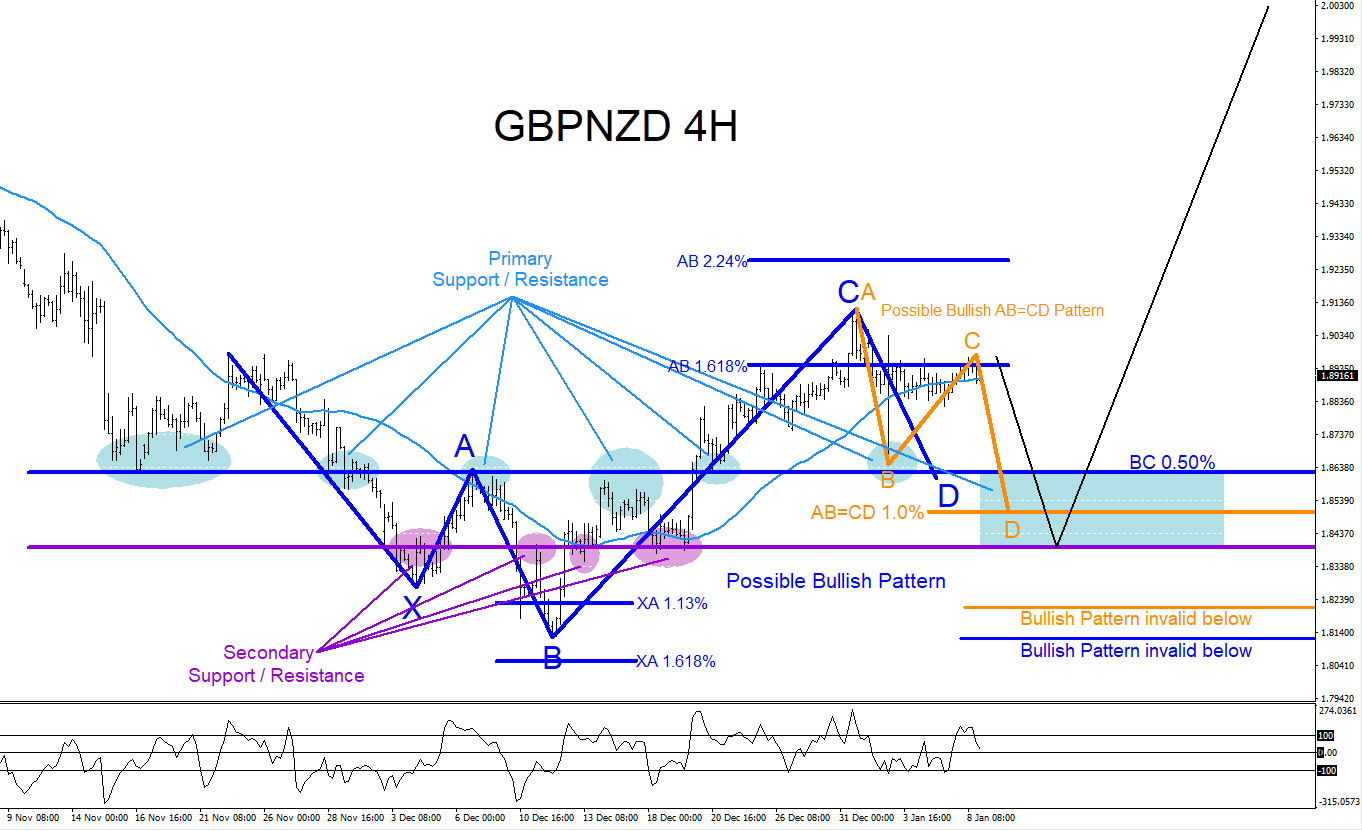
GBPNZD : Buy the Dip Scenario
Read MoreGBPNZD Technical Analysis January 8/2019 Bullish market patterns can be seen on the GBPNZD 4 hour chart. In the chart below there are possible bullish patterns that can trigger BUYS if the market makes another move lower. The orange bullish AB=CD pattern triggers BUYS at the Fib. extension 1.0% level and the blue bullish pattern […]