
-
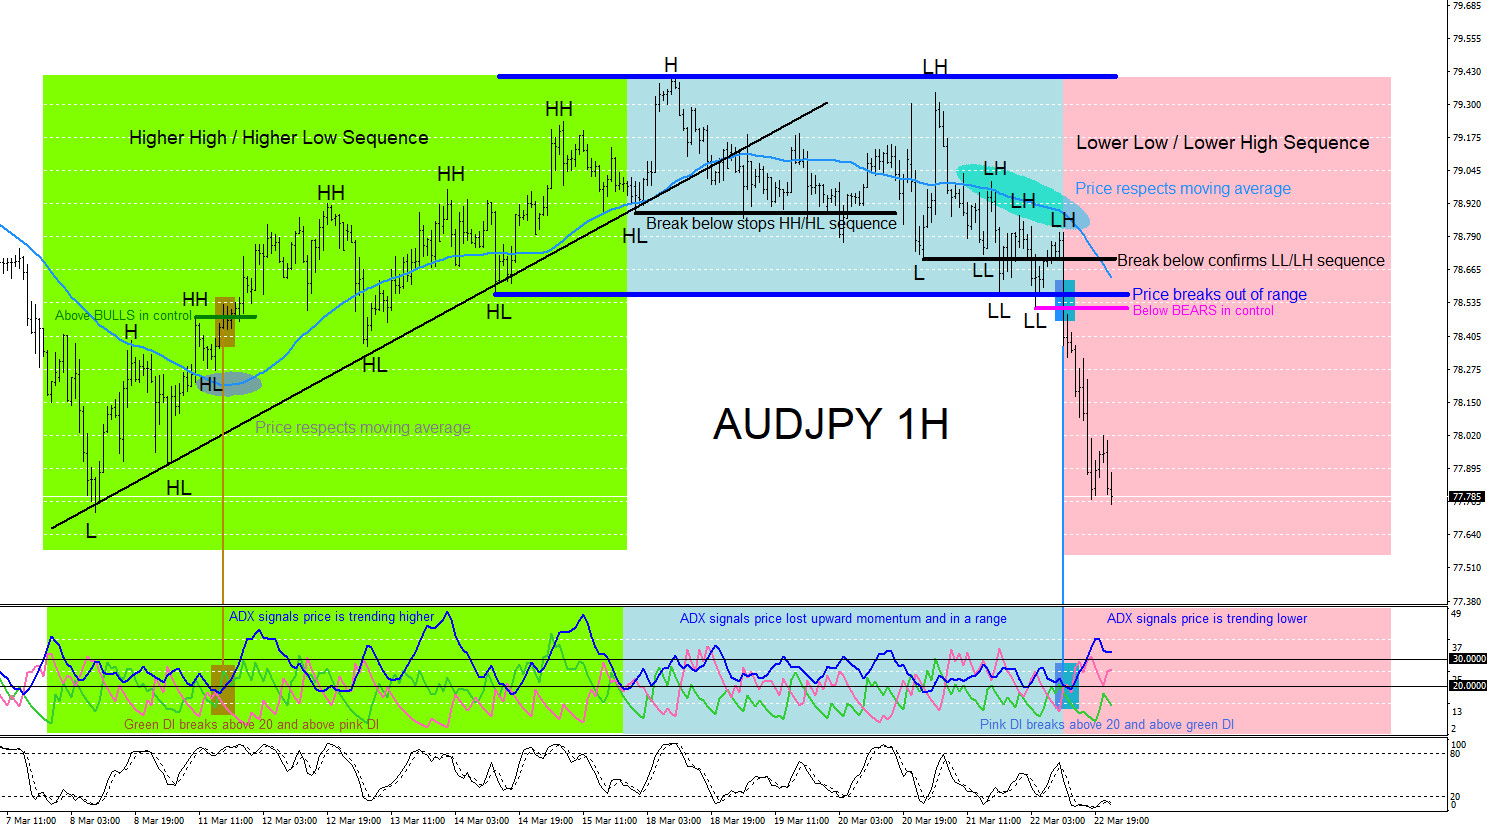
AUDJPY : Catching the Trend Lower
Read MoreAUDJPY Short Term Technical Analysis AUDJPY on March 8/2019 the pair bounced and traded higher. Price started a Higher High/Higher Low sequence and trended higher for the entire trading week of March 11-15/2019. In the chart below the ADX (Average Directional Movement Index) signalled that the move to the upside was losing momentum at the start […]
-
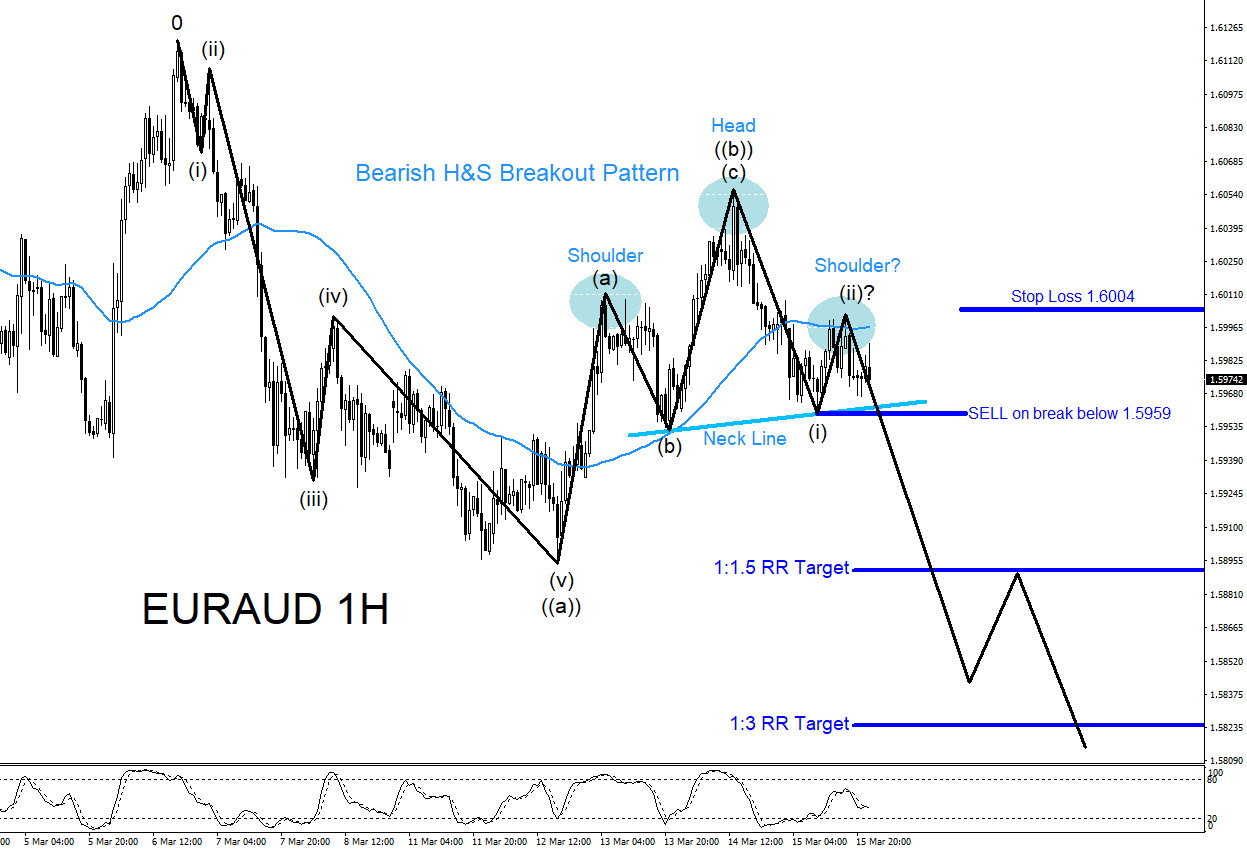
EURAUD : Trading Elliott Waves with Market Patterns
Read MoreEURAUD Technical Analysis March 17/2019 EURAUD SELL/SHORT Trade : Elliott Wave count for EURAUD shows wave ((a)) completed starting from the March 6/2019 highs and has since corrected higher to terminate possibly the wave ((b)) at the March 14/2019 high. Using Market Patterns together with a working Elliott Wave count allows traders to get more […]
-
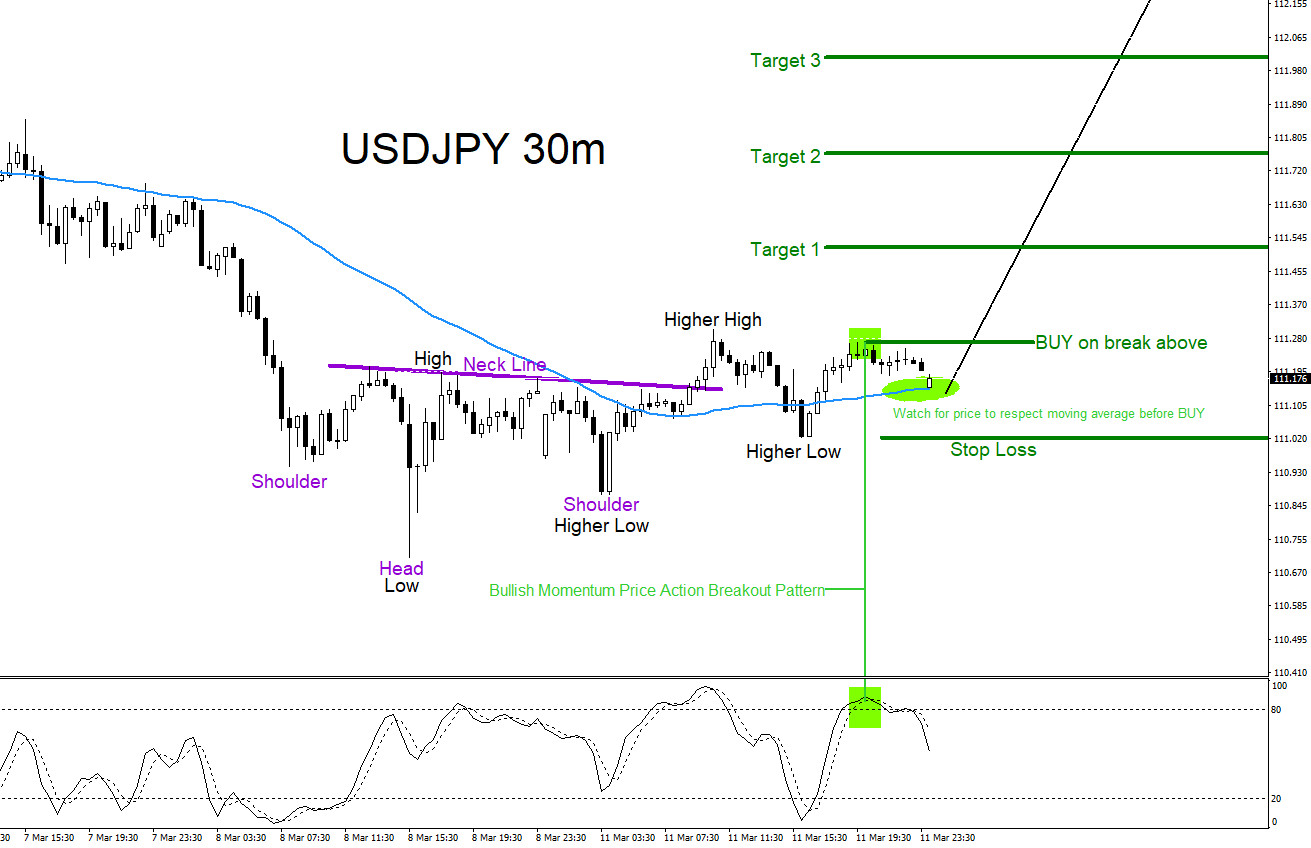
USDJPY : Higher High / Higher Low Sequence Trade Setup
Read MoreUSDJPY Technical Analysis March 11/2019 USDJPY BUY/LONG Trade Setup: USDJPY has formed a bullish inverted Head and Shoulders market breakout pattern (purple) and has already broken above the neck line BUY entry so we will expect more possible upside in the following days. A Higher High / Higher Low Sequence has started signalling that the […]
-
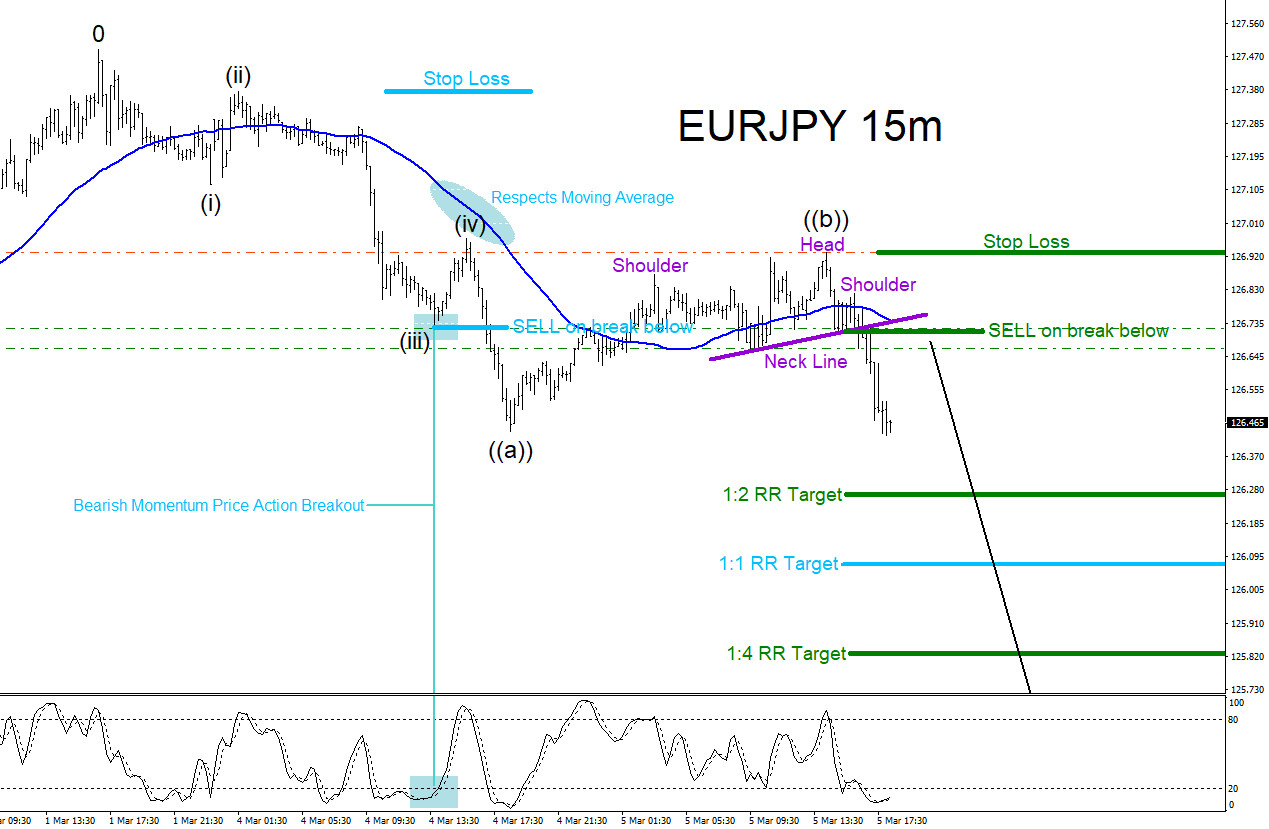
EURJPY : Trading Elliott Waves with Market Patterns
Read MoreEURJPY Technical Analysis March 5/2019 EURJPY SELL/SHORT Trade : Elliott Wave count for EURJPY shows wave ((a)) completed starting from the March 1/2019 highs and has since corrected higher to terminate possibly the wave ((b)) at the March 5/2019 high. Using Market Patterns together with a working Elliott Wave count allows traders to get more […]
-
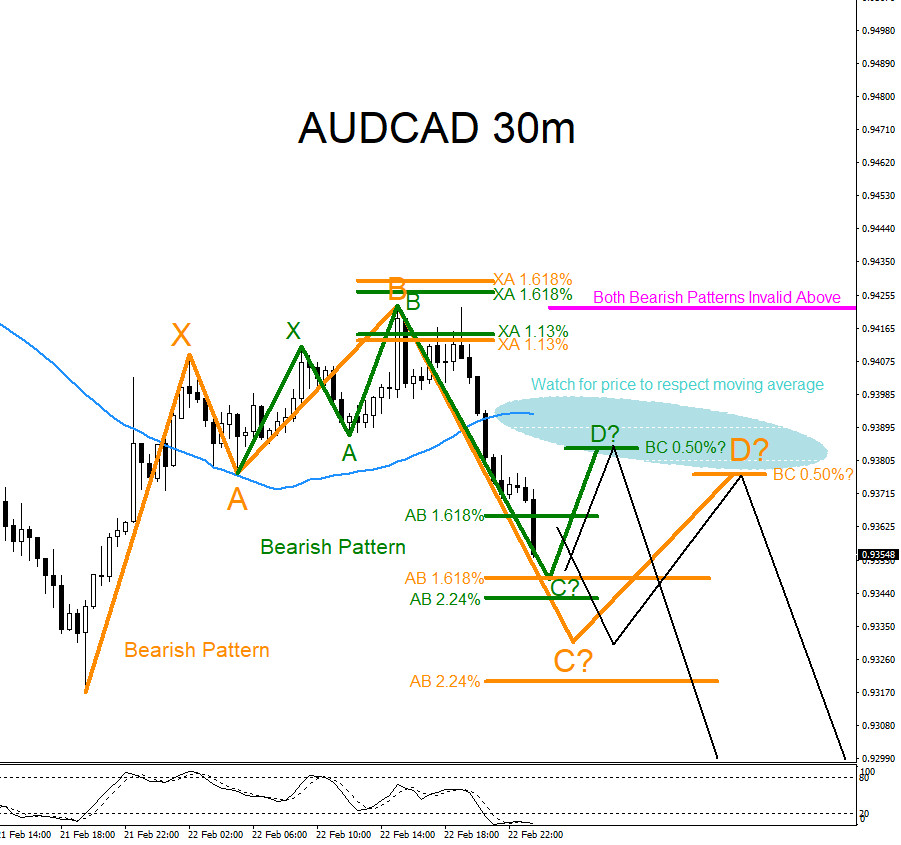
AUDCAD : Market Patterns Calling More Downside?
Read MoreAUDCAD Technical Analysis February 24/2019 AUDCAD : Bearish market patterns can be seen on the AUDCAD 30 minute chart. In the chart below there are possible bearish patterns that can trigger SELLS if the market makes a minimal bounce higher. Both the green and orange bearish patterns triggers SELLS at the BC 0.50% Fib. retracement […]
-
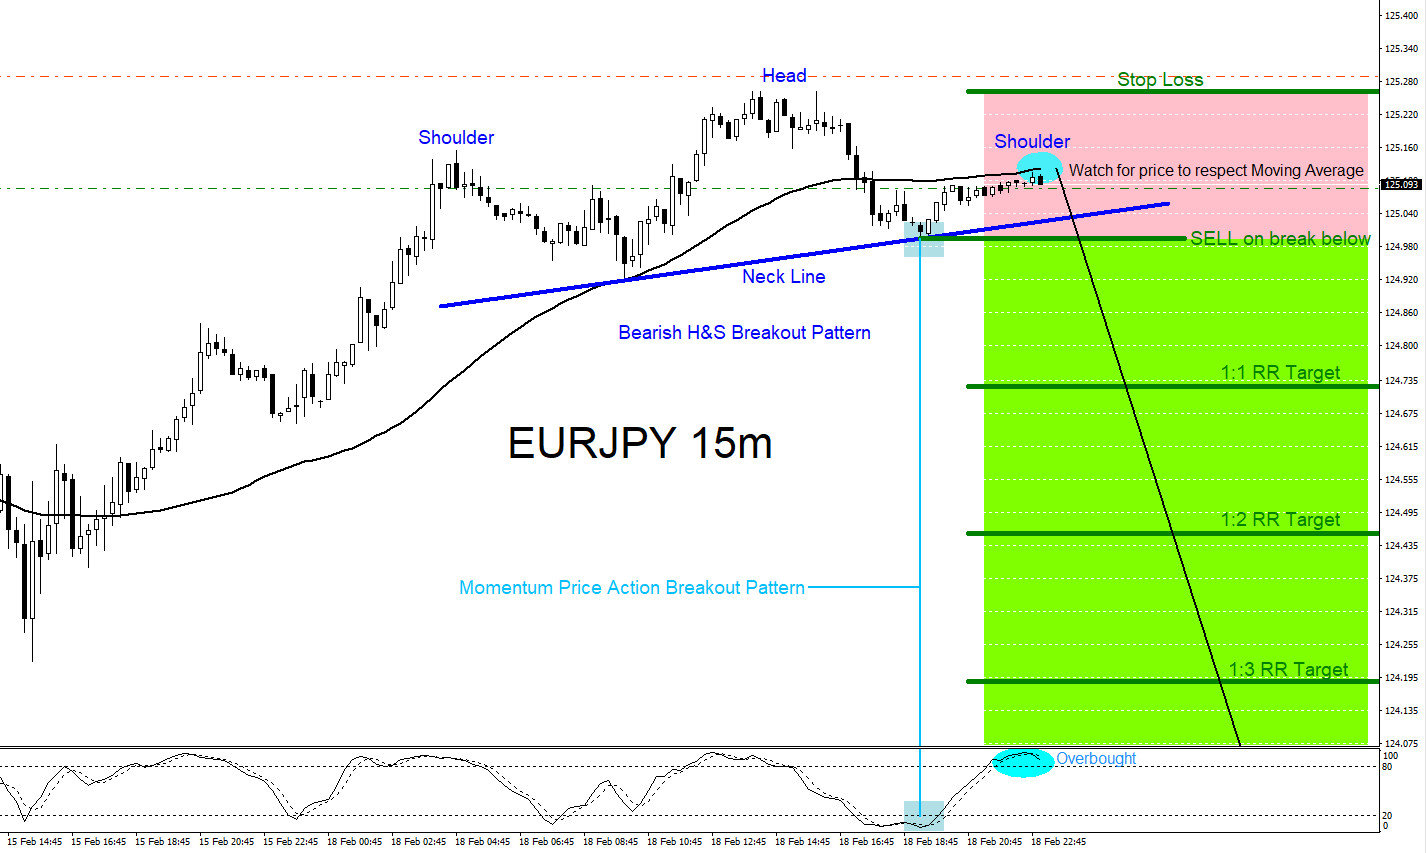
EURJPY Possible Breakout Lower?
Read MoreEURJPY Technical Analysis February 18/2019 EURJPY SELL/SHORT Trade Setup : EURJPY is forming a bearish Head and Shoulders market breakout pattern. Price at the moment seems to be respecting the 50 Moving Average which can signal for more downside. Traders should watch for a break below the green SELL breakout trend line. A good break […]