
-
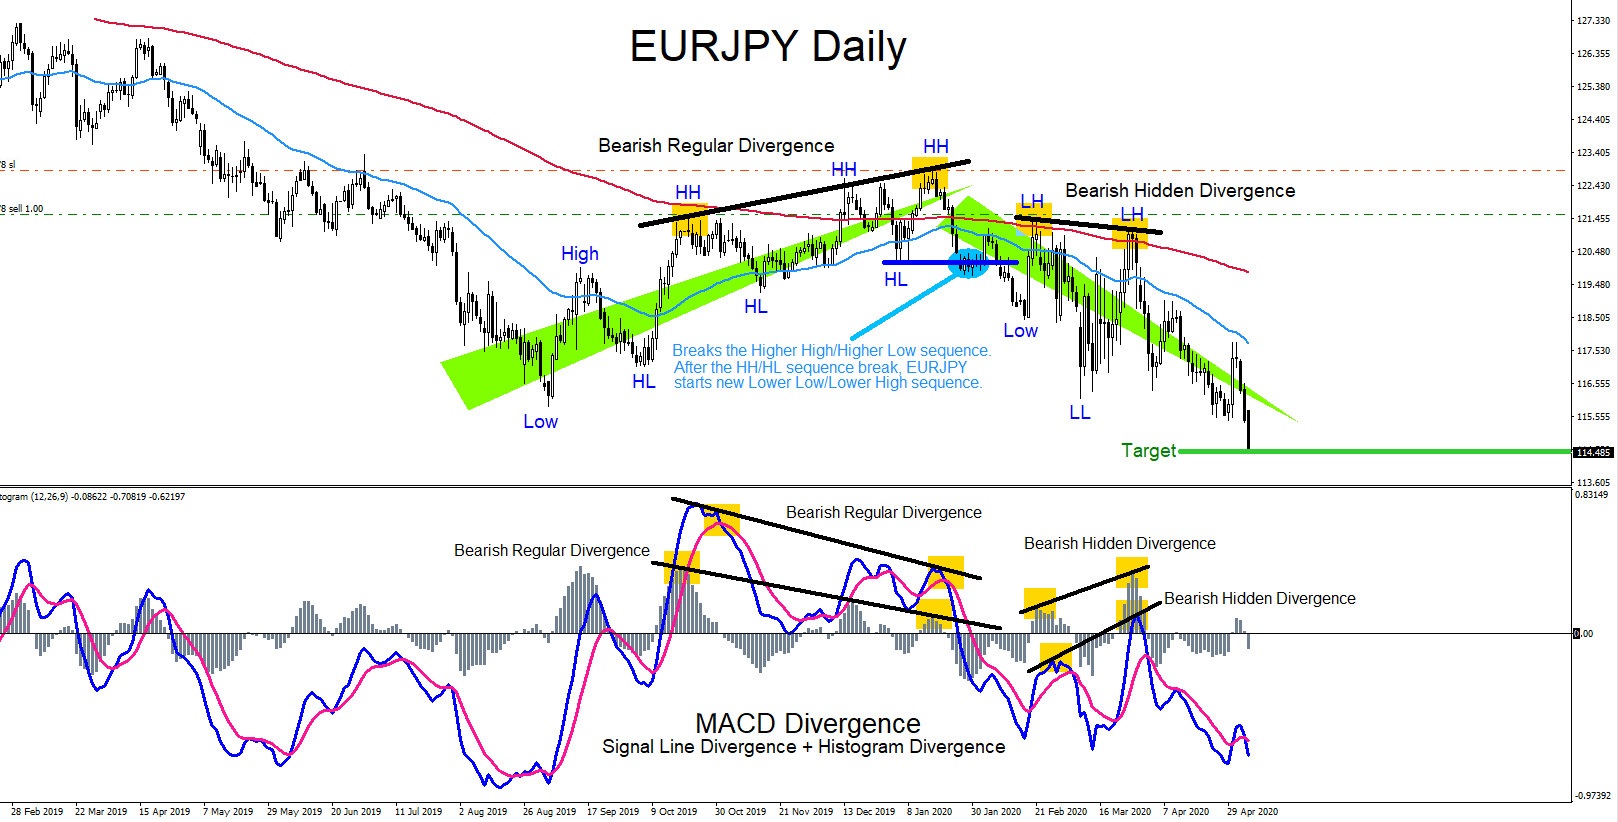
Divergence Trading Patterns
Read MoreDivergence trading patterns can signal traders of possible trade setups. There are 2 types of divergence patterns, regular divergence and hidden divergence. Both patterns can signal a trader on which side to trade the market. A divergence pattern is when price is moving in one direction but the oscillator indicator is moving in a different direction. […]
-
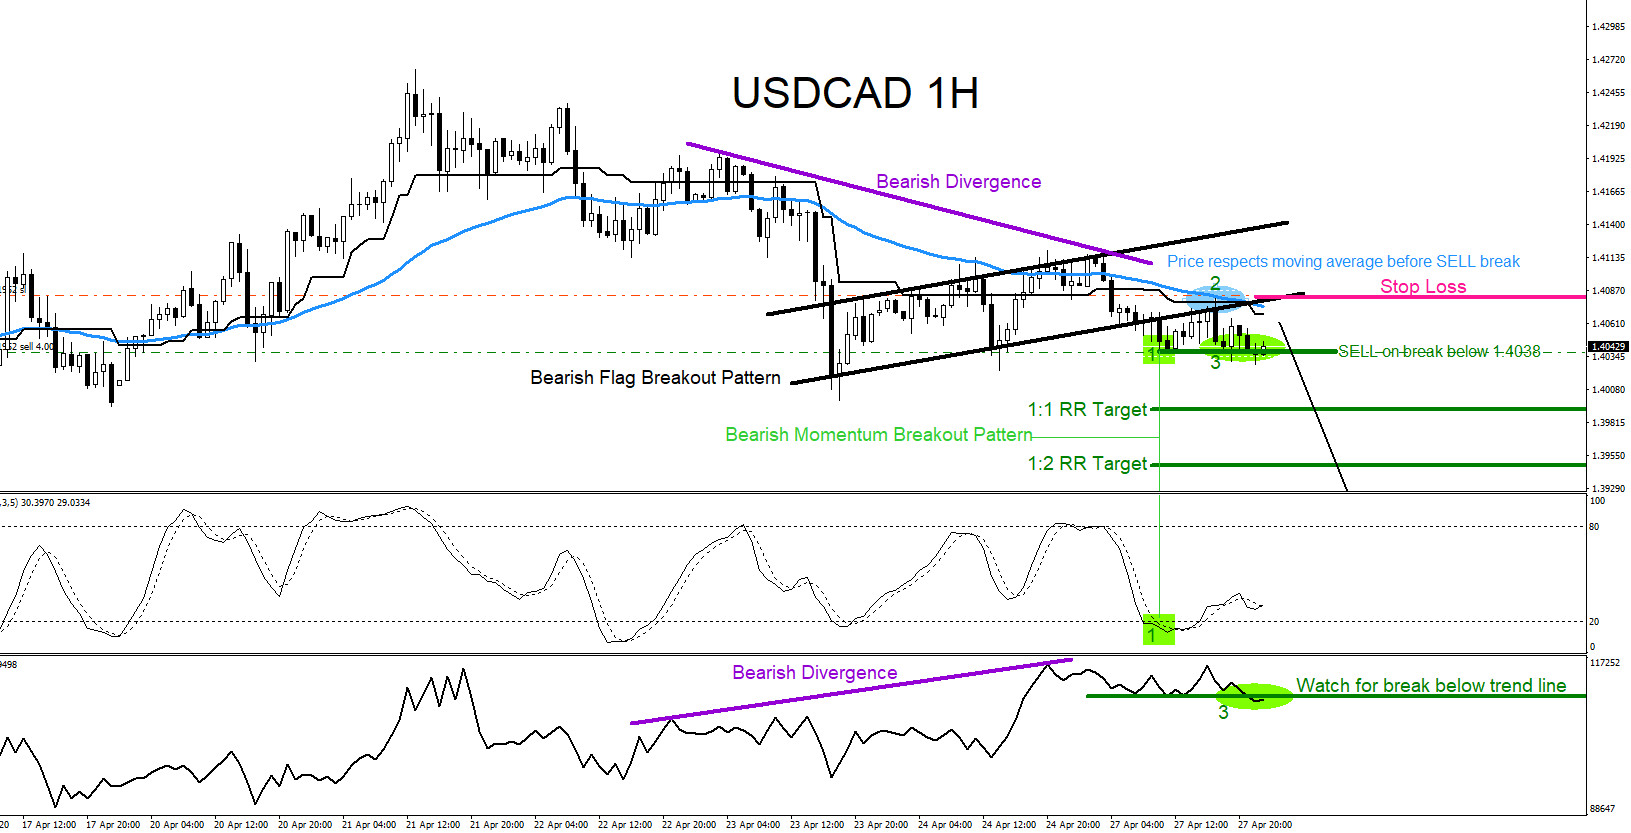
USDCAD : Trading the Breakout Lower
Read MoreUSDCAD Technical Analysis On April 27/2020 I posted on social media (Stocktwits/Twitter) @AidanFX “USDCAD Still possible the pair can extend lower below 1.4000. Possible momentum breakout lower at 1.4038“ USDCAD 1 Hour Chart April 27.2020 : The chart below was also posted on social media (StockTwits/Twitter) @AidanFX April 27/2020 showing that a bearish flag breakout pattern (black) […]
-
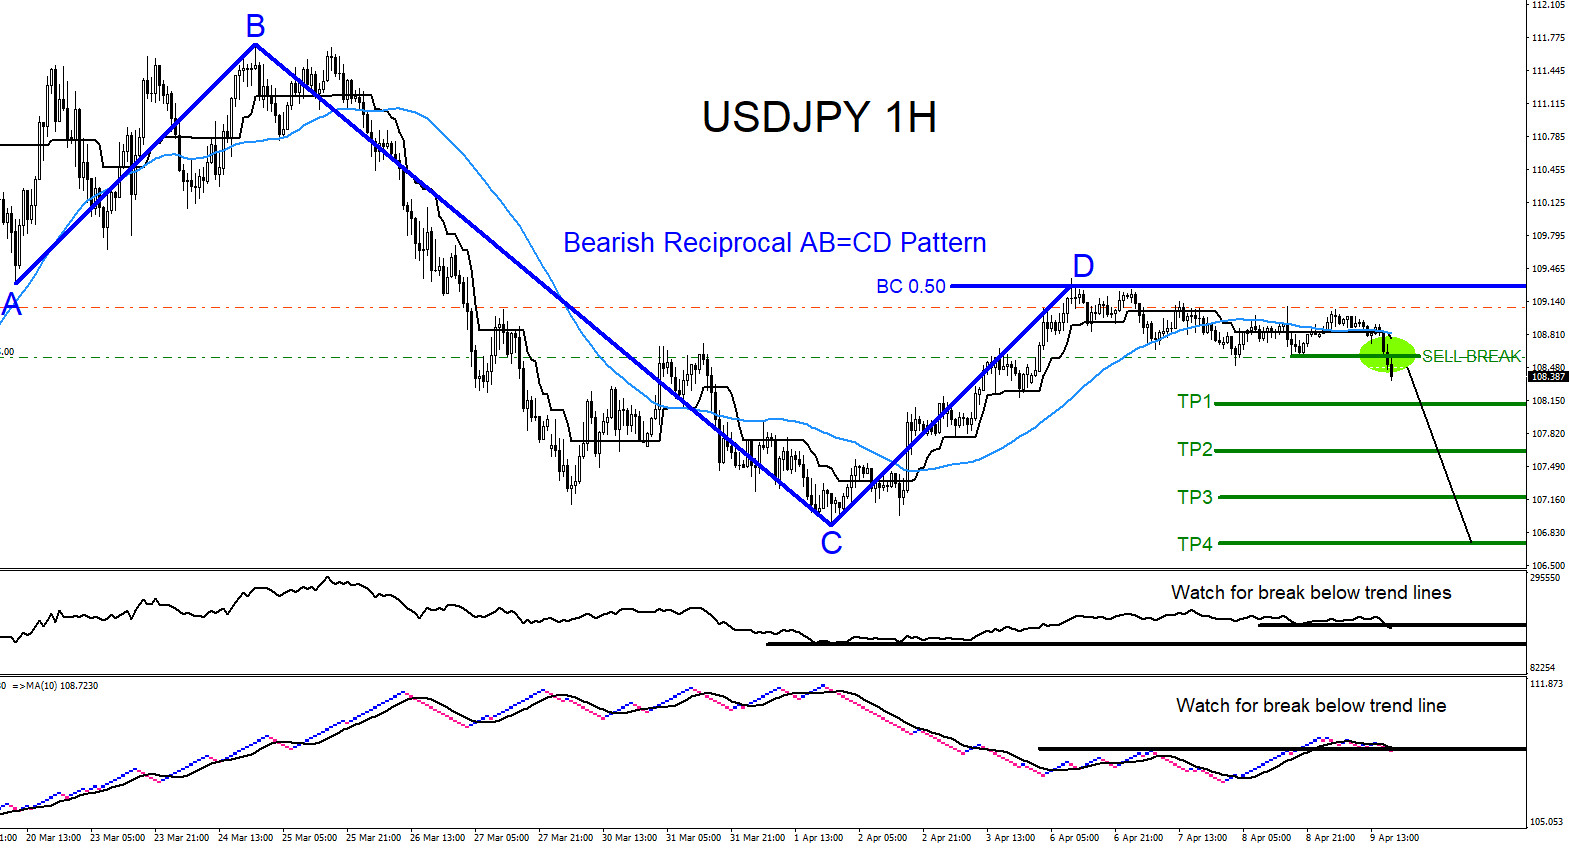
USDJPY : Calling the April 2020 Move Lower
Read MoreUSDJPY Technical Analysis On April 8/2020 I posted on social media (Stocktwits/Twitter) @AidanFX “USDJPY Break below 108.60 can push the pair lower towards 108 area“ USDJPY 1 Hour Chart April 9.2020 : The chart below was also posted on social media (StockTwits/Twitter) @AidanFX April 9/2020 showing that a bearish reciprocal AB=CD pattern (dark blue) has formed […]
-
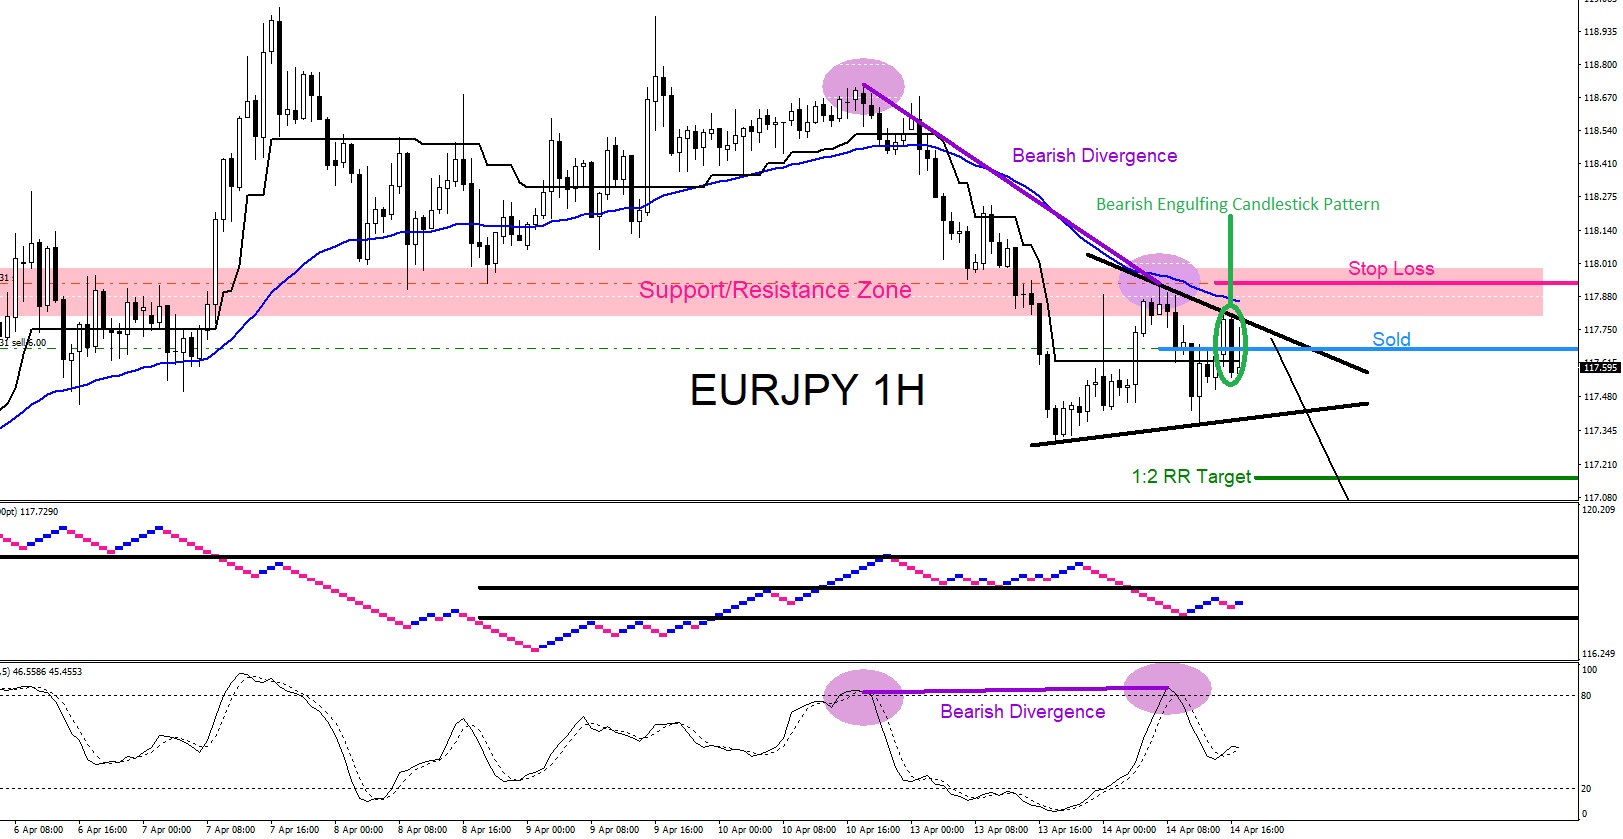
EURJPY : Market Patterns Calling the Move Lower
Read MoreEURJPY Technical Analysis On April 14/2020 I posted on social media (Stocktwits/Twitter) @AidanFX the SELL trade setup “Sell EURJPY @ 117.67 Stop Loss @ 117.93 Target @ 117.15“ EURJPY 1 Hour Chart April 14.2020 : The chart below was also posted on social media (StockTwits/Twitter) @AidanFX April 14/2020 showing that price hit a clear Support/Resistance Zone (pink) […]
-
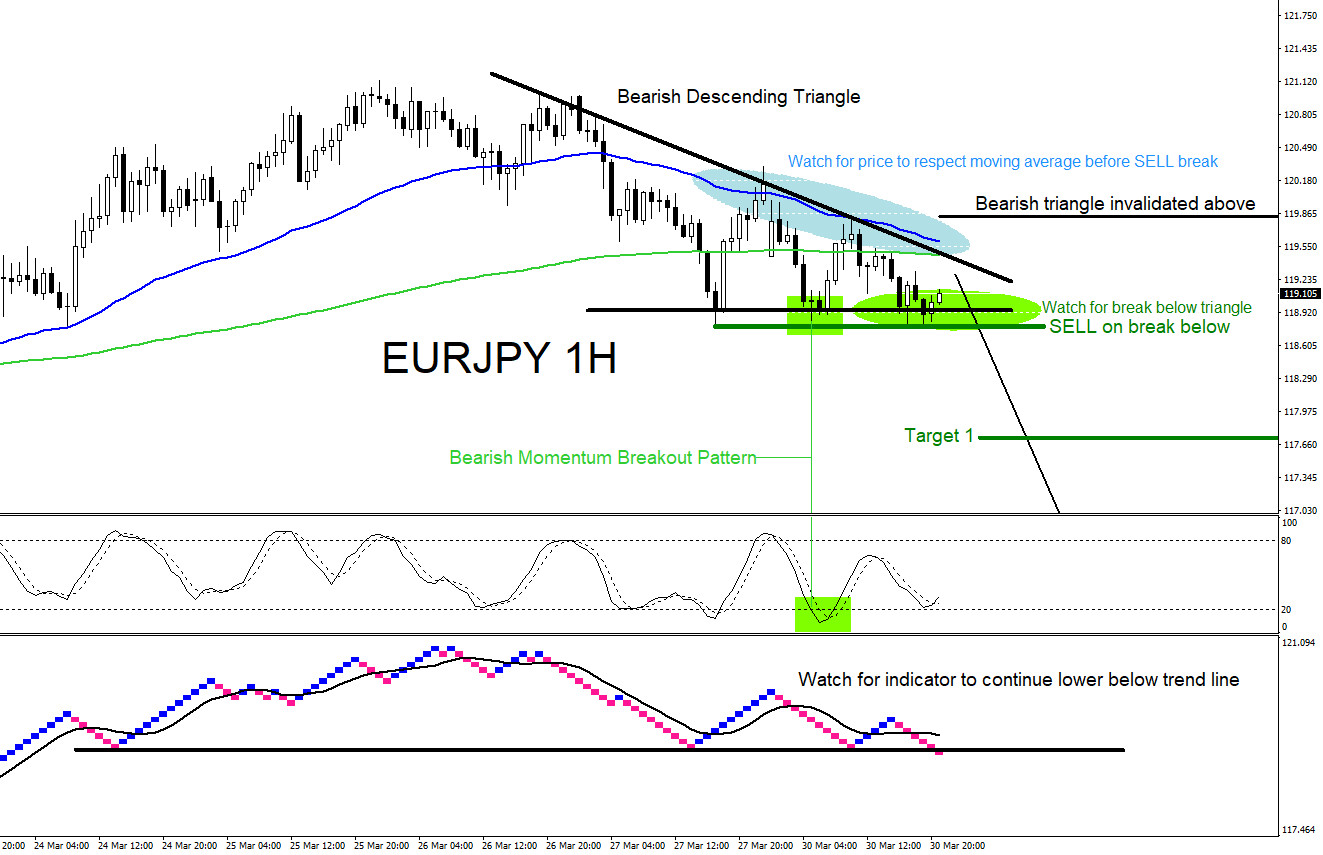
EURJPY : Trading a Triangle Breakout Pattern
Read MoreEURJPY Technical Analysis On March 30/2020 I posted on social media (Stocktwits/Twitter) @AidanFX “Will be watching for possible selling opportunities $EURJPY“ EURJPY 1 Hour Chart March 30.2020 : The chart below was also posted on social media (StockTwits/Twitter) @AidanFX March 30/2020 showing that a bearish descending triangle breakout pattern (black) was forming. I called for traders […]
-
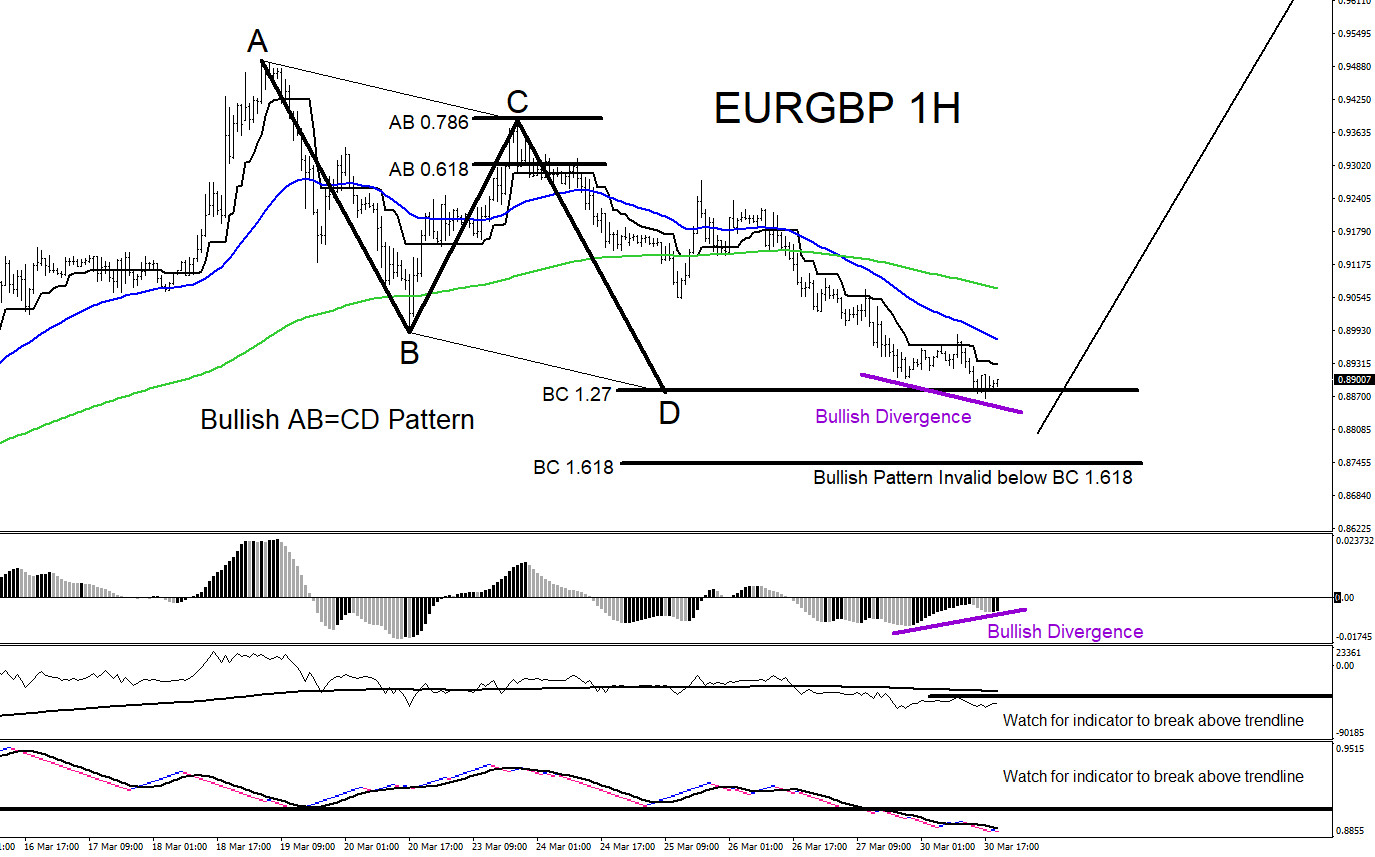
EURGBP : Will the Pair Bounce Higher?
Read MoreEURGBP Technical Analysis March 30/2020 EURGBP : There are clear visible bullish market patterns on the 1 hour chart but traders will still need to wait for more confirmation that a bottom will form and for price to bounce higher. Bullish AB=CD pattern triggers BUYS in the BC 1.27-1.618 Fib. levels. Price has already reached […]