
-
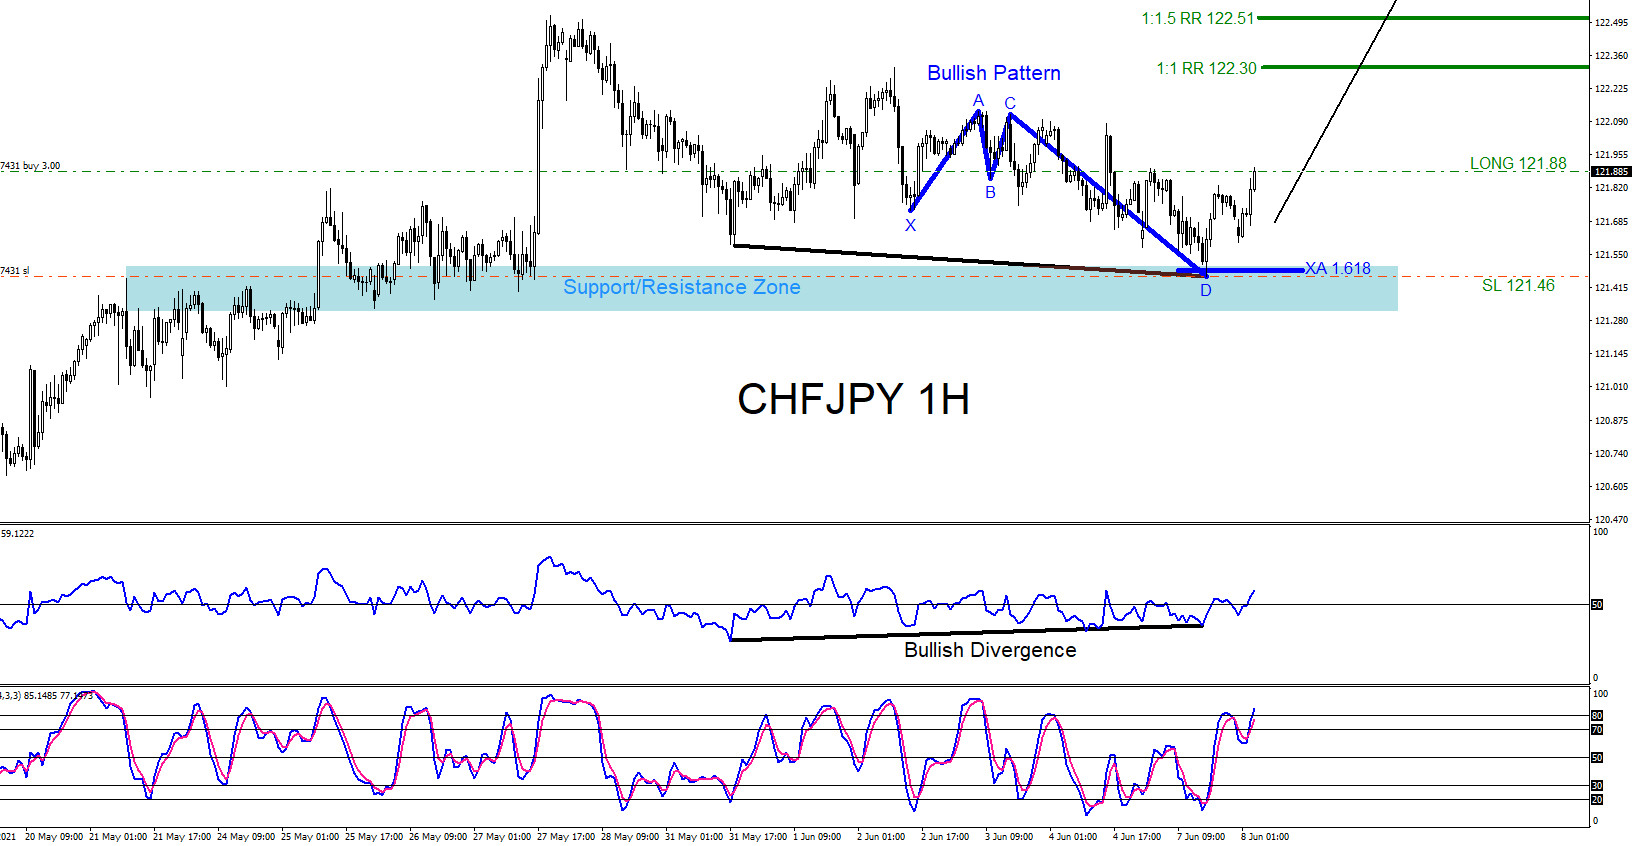
CHFJPY : Multiple Bullish Market Patterns Signalled the Move Higher
Read MoreThe CHFJPY chart below was posted on social media @AidanFX June 7 2021 showing the possible bullish patterns. Blue bullish pattern triggered BUYS perfectly in the blue support/resistance zone. This support/resistance zone acted as a good support area where price reacted with a move higher. More added reason the pair could push higher was a […]
-
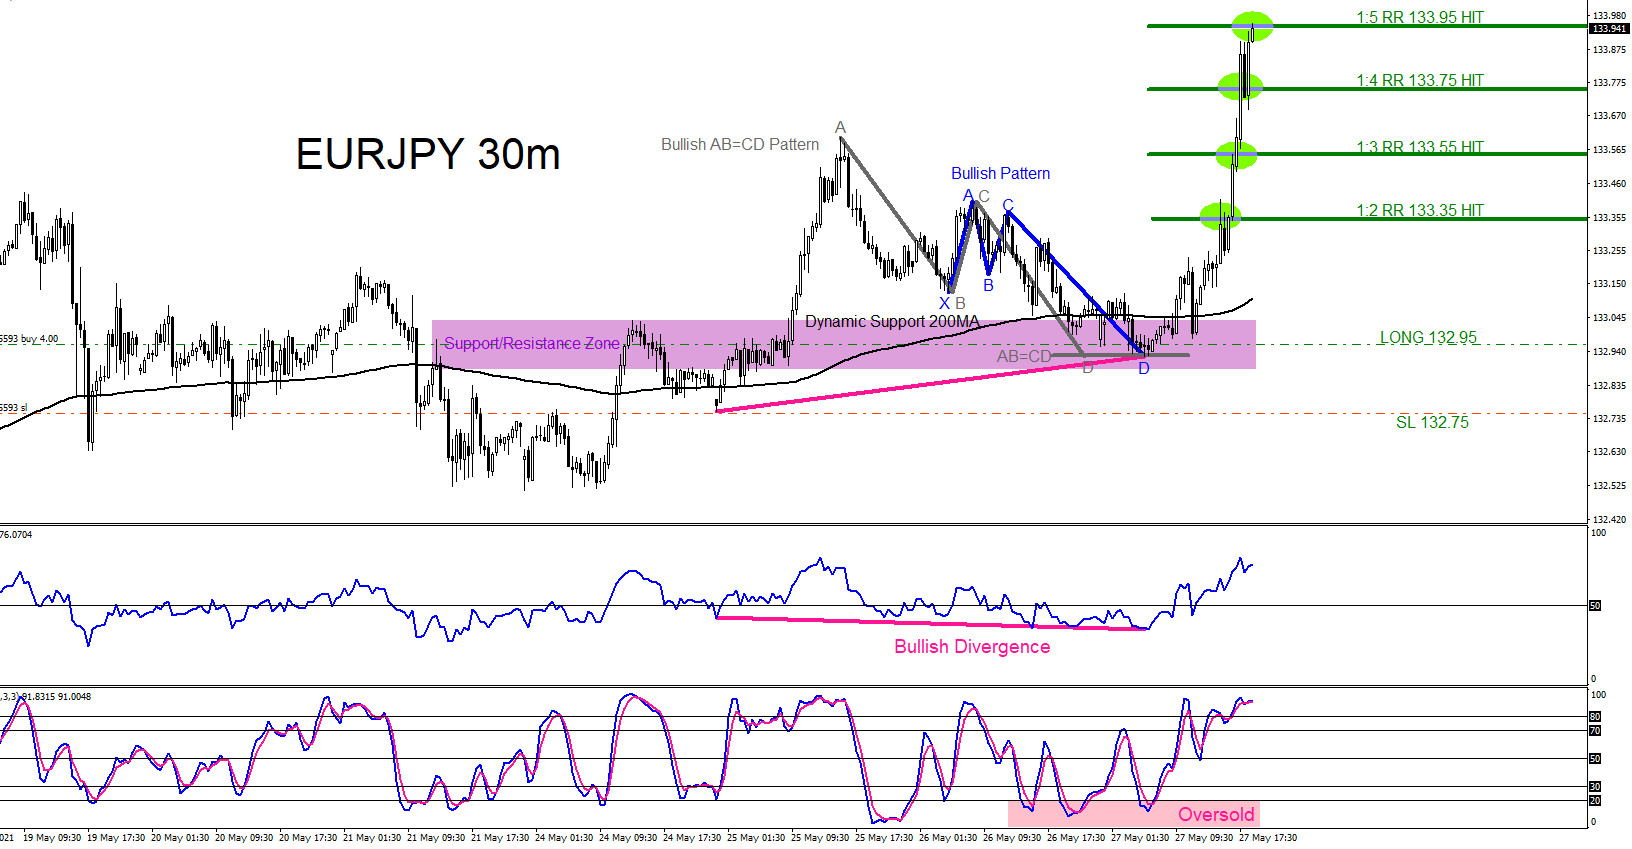
EURJPY : Trading the Upside Move
Read MoreSince May 2020 to May 2021 EURJPY has been trending higher for the whole 12 months. On May 26 2021 we advised traders, in our members area, that EURJPY was in a position where the pair will make another move higher. We at EWF always encourage our members to trade with the trend and not […]
-
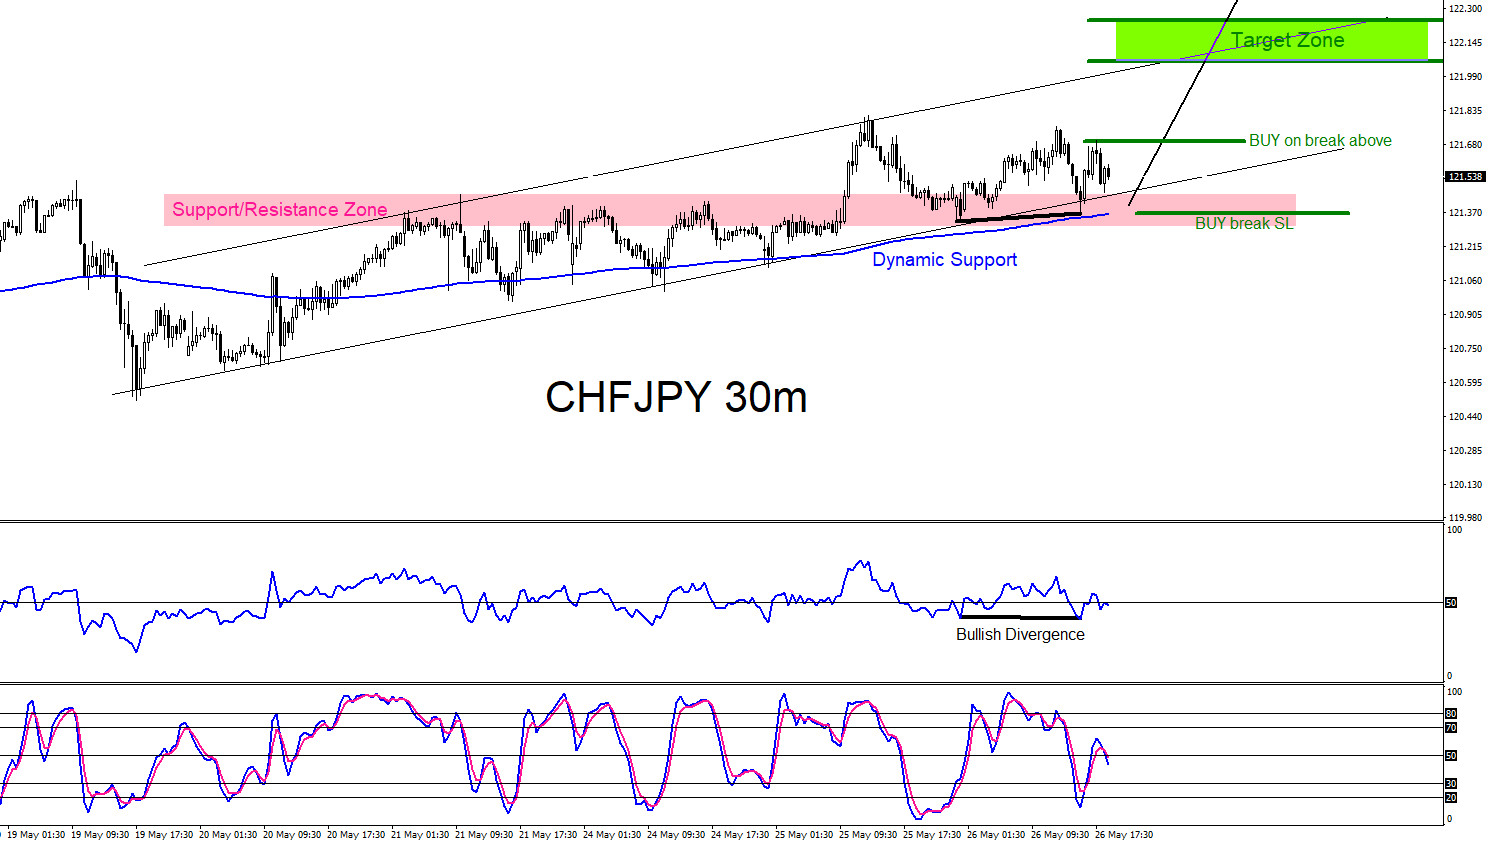
CHFJPY Moves Higher as Expected
Read MoreOn May 26 2021 I posted on social media @AidanFX “CHFJPY watching for buying opportunities for another push higher towards 122.00 – 122.20 area.” and “CHFJPY a break above 121.70 will add more bulls/buyers to get in the market.” The chart below was also posted on social media @AidanFX May 26 2021 showing the possible […]
-
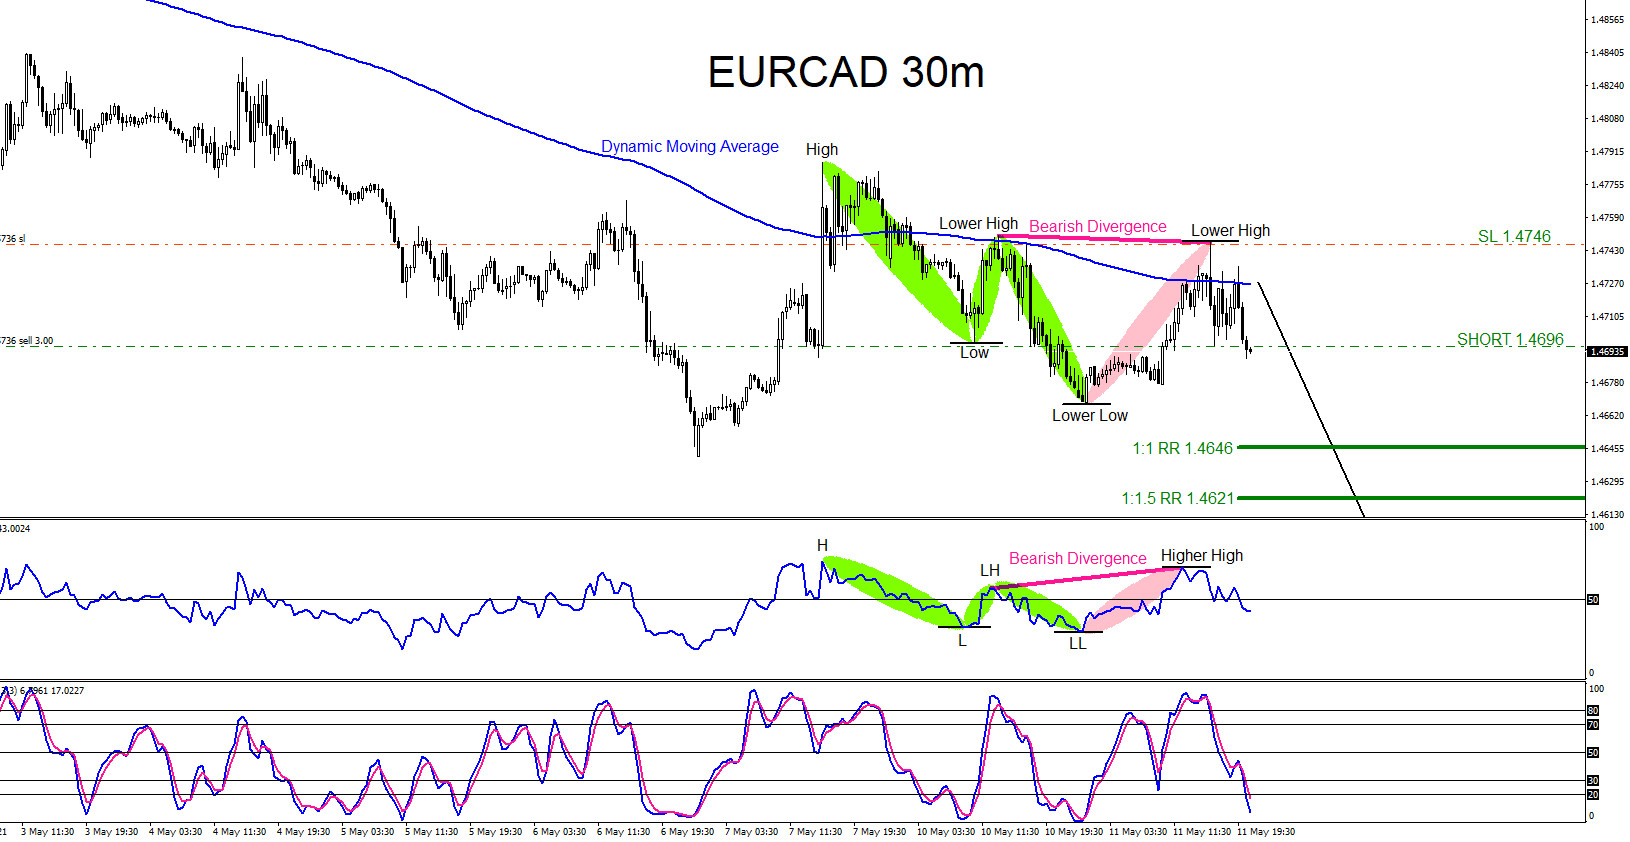
EURCAD : Catching the Move Lower
Read MoreSince April 21/2021, EURCAD has been trending to the downside. To determine if a market is trending, price action must be forming higher highs/higher lows in an uptrend and lower lows/lower highs in a downtrend. We at EWF always recommend our clients to trade with the trend and not against it. On May 11 2021 […]
-
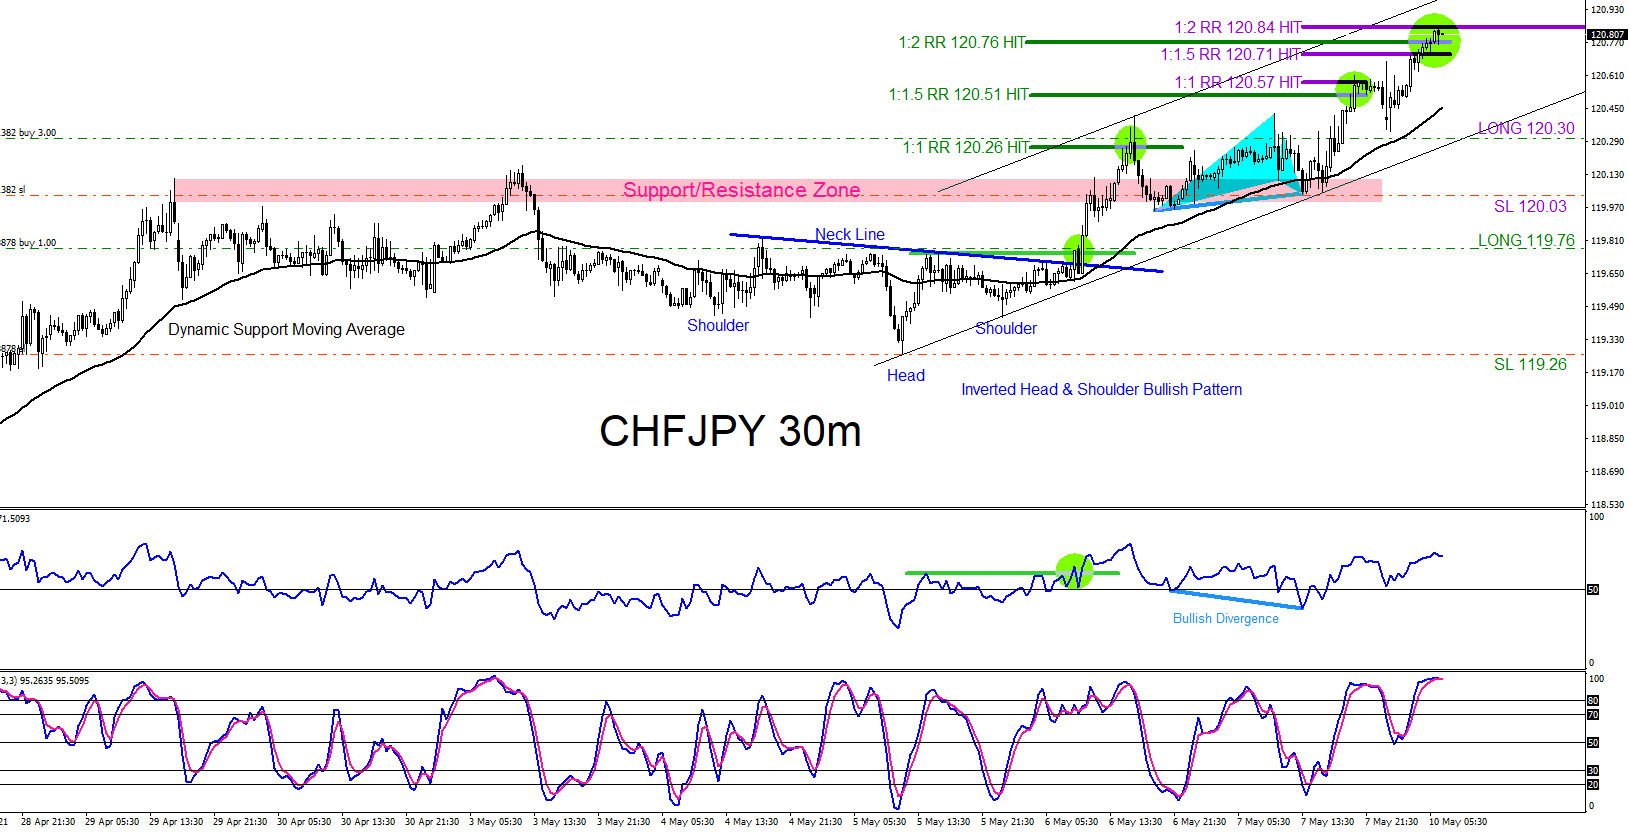
CHFJPY : Bullish Market Patterns Calling the Move Higher
Read MoreOn May 5 2021 I posted on social media @AidanFX “CHFJPY As long as price stays above 119.26 the pair will move higher towards the 120.50 area. Will be watching for buying opportunities” and “Watch for CHFJPY BUY on break above 119.76 with stops at 119.26 targeting the 120.26 – 120.50 area.” On May 7 2021 […]
-
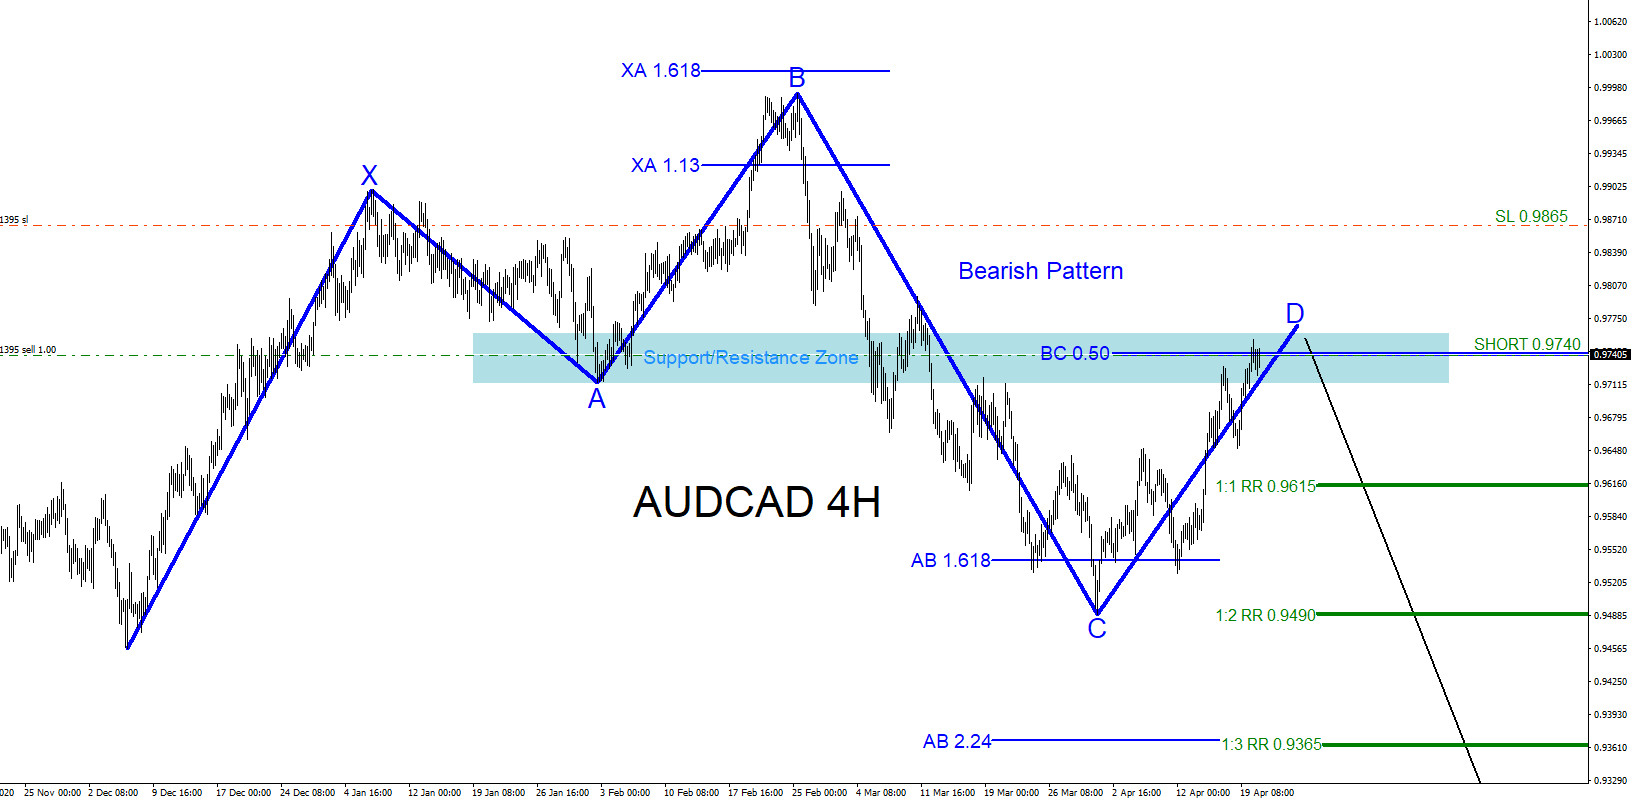
AUDCAD : Tracking and Trading the Move Lower
Read MoreOn April 19 2021 I published an article calling for AUDCAD to move lower -> AUDCAD : Possible Bearish Pattern? . In the article I explained where possible sellers would be waiting to enter and push the pair lower. The first chart below was posted on social media @AidanFX April 14 2021 and the second […]