
-

NZDJPY Moves Higher as Expected
Read MoreOn October 13 2021 I posted on social media @AidanFX “NZDJPY can pop higher towards the 79.18 – 79.38 area. Watch for any buying opportunities for a in and out trade.“ The chart below was also posted on social media @AidanFX October 13 2021 showing the possible NZDJPY bullish scenario. Price formed a bullish divergence pattern […]
-
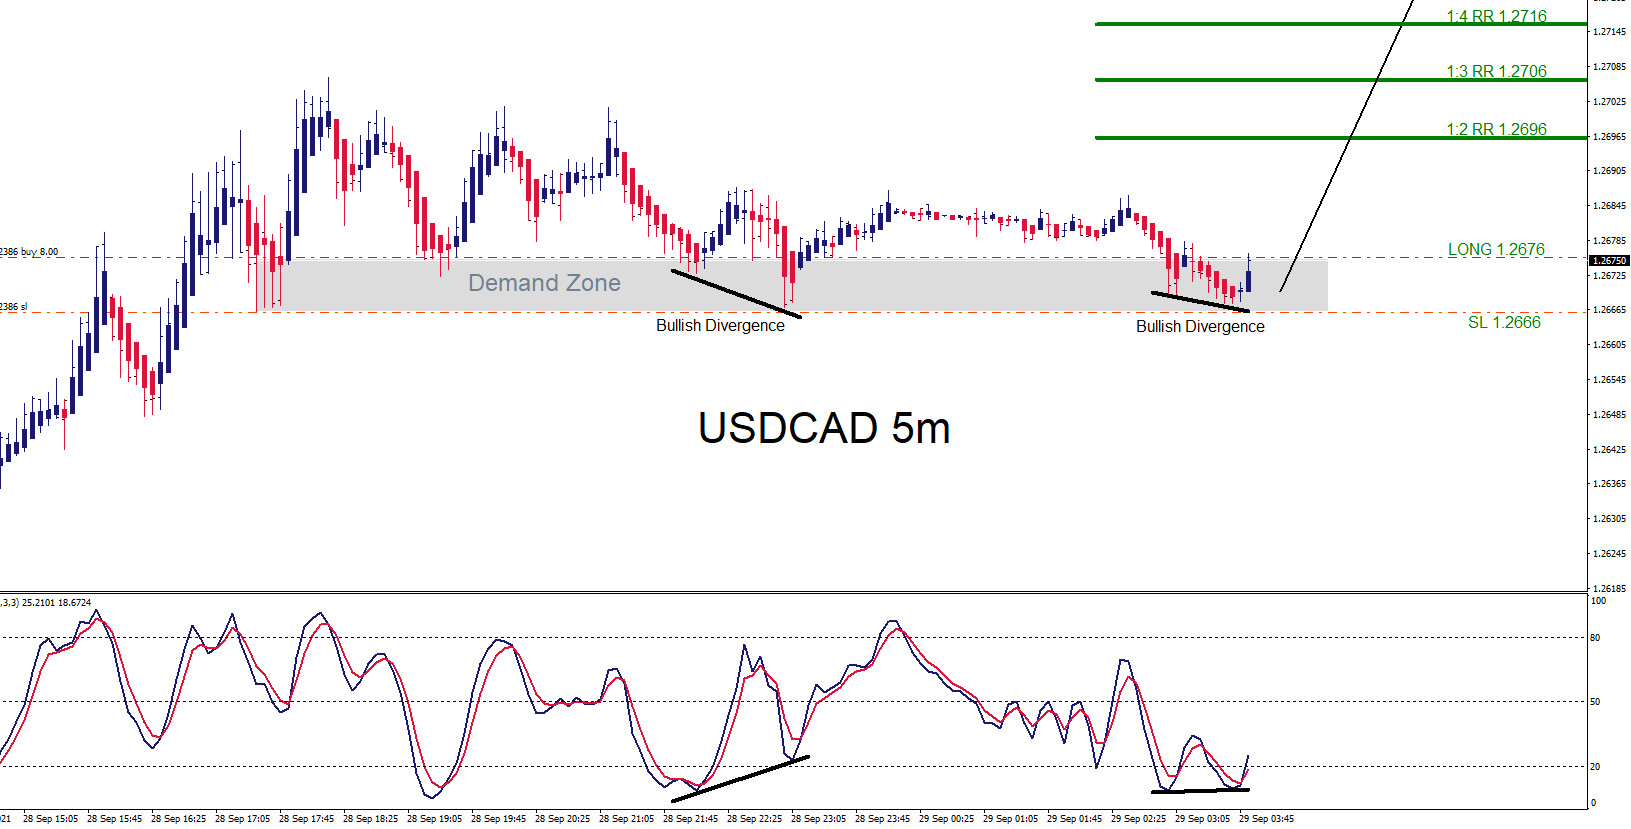
USDCAD : Trading the Move Higher
Read MoreOn September 28 2021 I posted on social media @AidanFX “USDCAD as long price stays above 1.2666 the pair can still push higher towards 1.2720 area.“ The chart below was also posted on social media @AidanFX September 28 2021 showing the possible bullish scenario. Price is in a Demand Zone (grey box) signalling traders that this […]
-
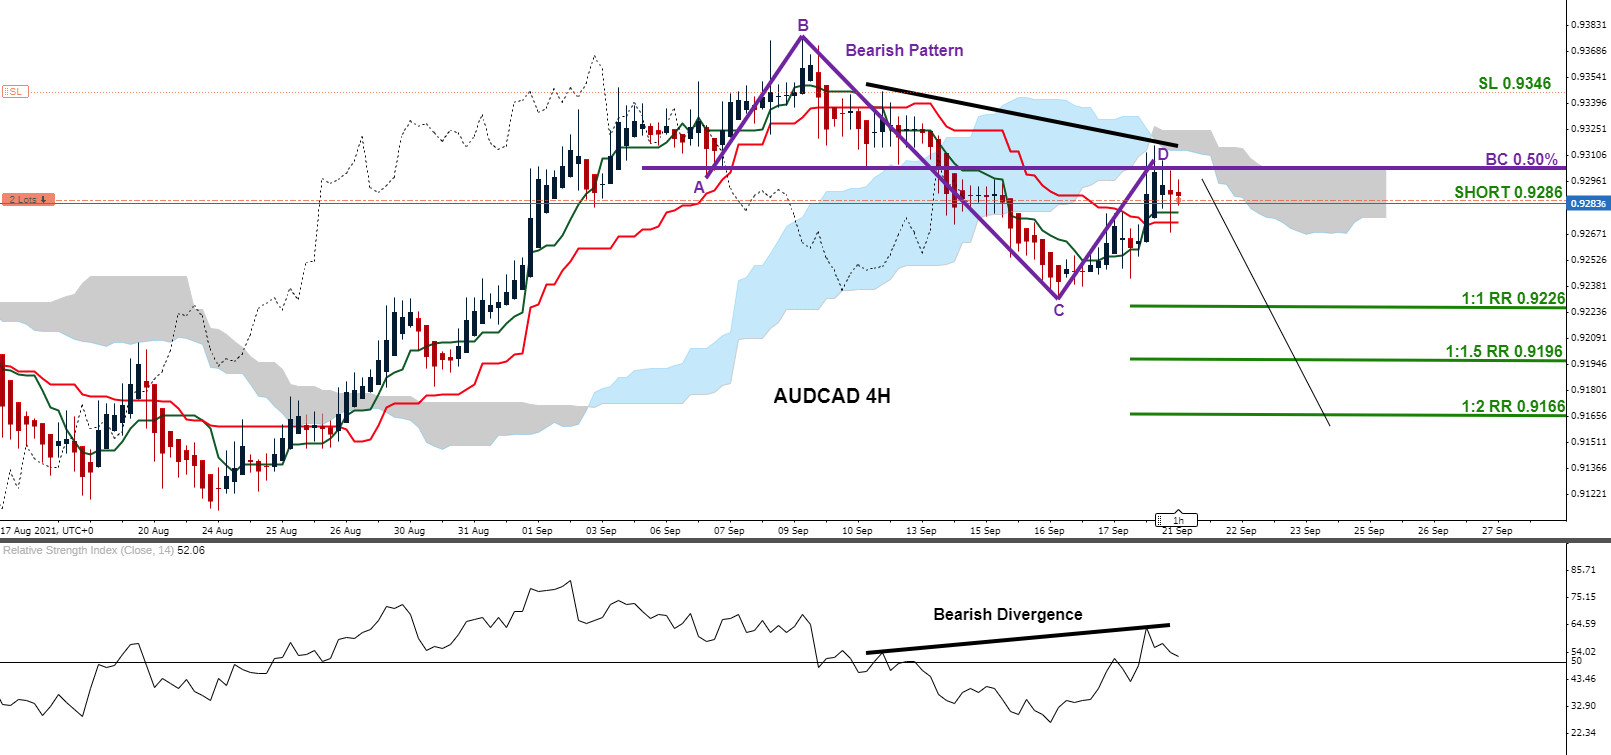
AUDCAD : Bearish Patterns Signalled the Move Lower
Read MoreThe chart below was posted on social media @AidanFX September 21 2021 showing the AUDCAD bearish scenario. Price formed a bearish divergence pattern (black) on indicator and price on September 20 2021 and was then followed with a move lower. The bearish divergence pattern (black) with the reciprocal AB=CD bearish pattern (purple) terminating point D at […]
-
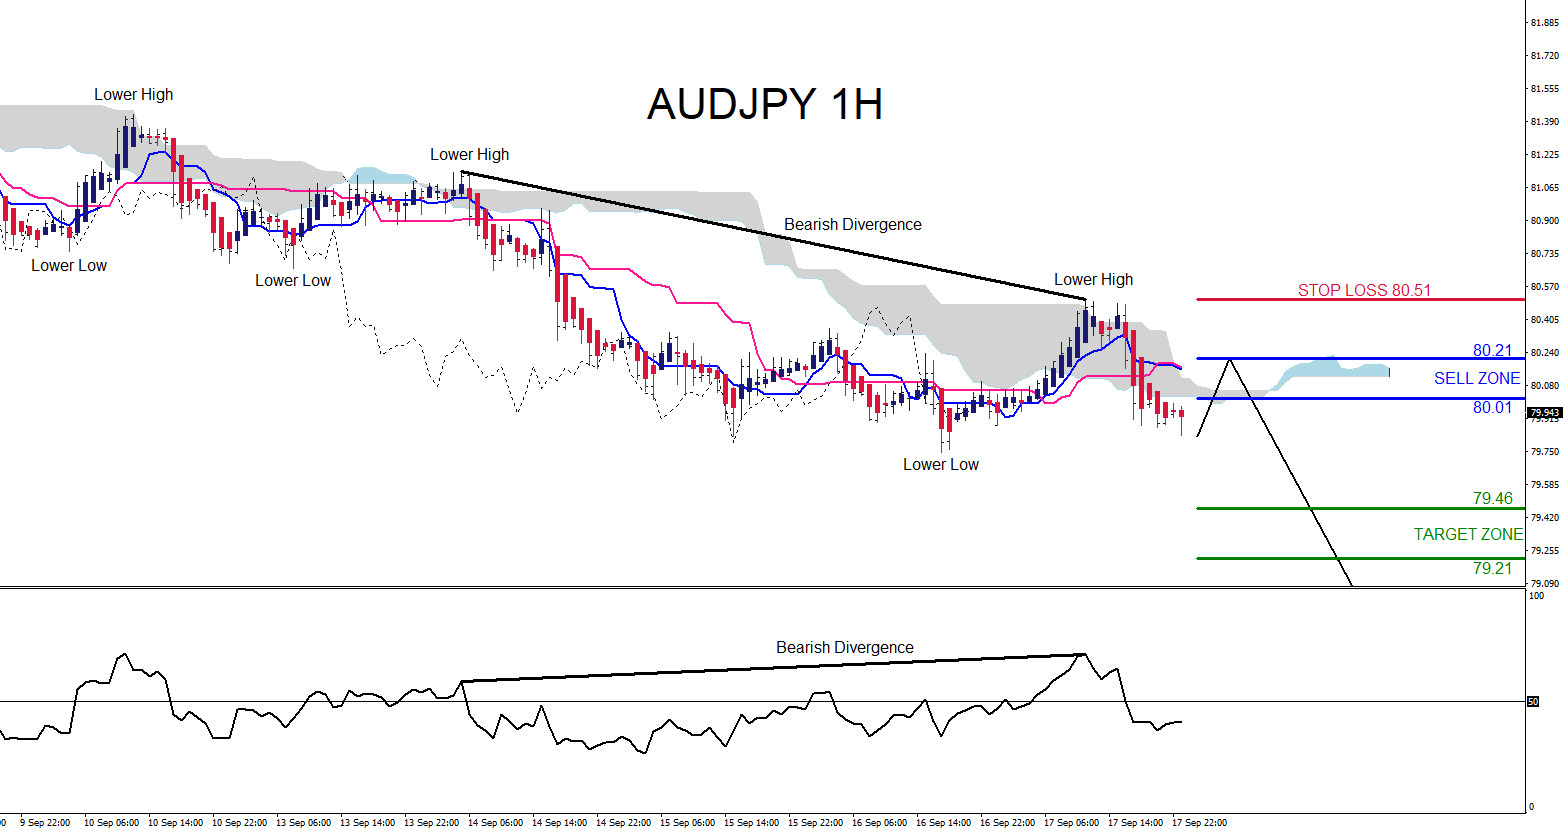
AUDJPY : Watch for a Continuation Move Lower
Read MoreOn September 19 2021 I posted on social media @AidanFX “ AUDJPY for coming trading week watch for selling opportunities as long price remains below 80.51 looking for a move lower towards 79.46 – 79.21 area. “ AUDJPY can be getting ready for another possible move lower. In the 1 hour chart below, the pair has […]
-
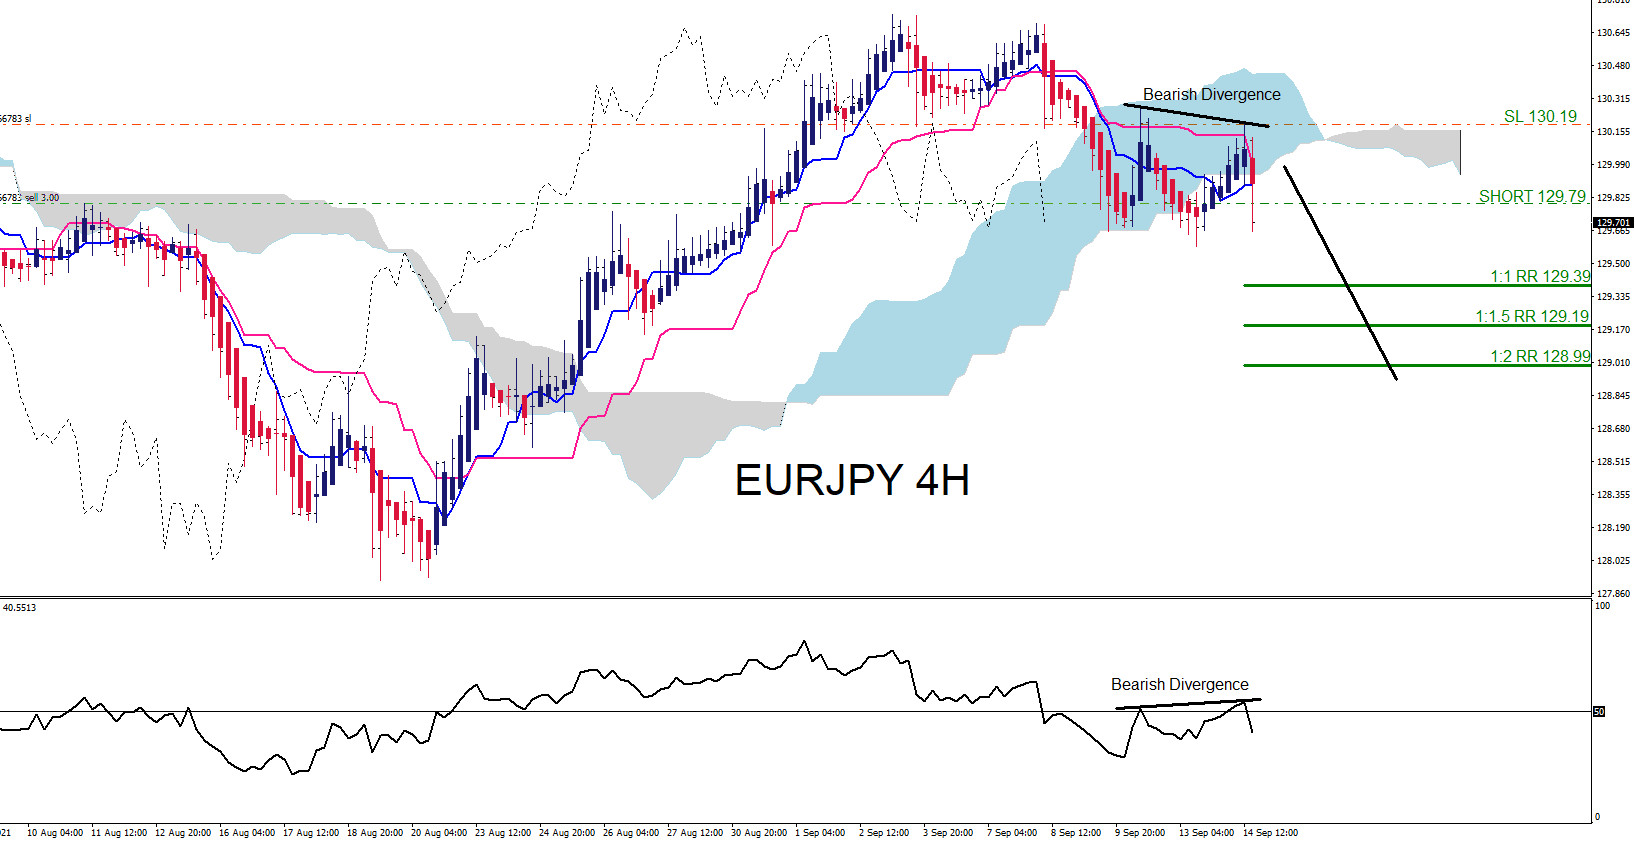
EURJPY : Trading the Move Lower
Read MoreOn September 14 2021 I posted on social media @AidanFX “EURJPY SHORT 129.79 Stop Loss 130.19 Target 129.39 – 128.99 area.“ The chart below was also posted on social media @AidanFX September 14 2021 showing the possible EURJPY bearish scenario. Price formed a bearish divergence pattern (black) on indicator and price on September 14 2021 and […]
-
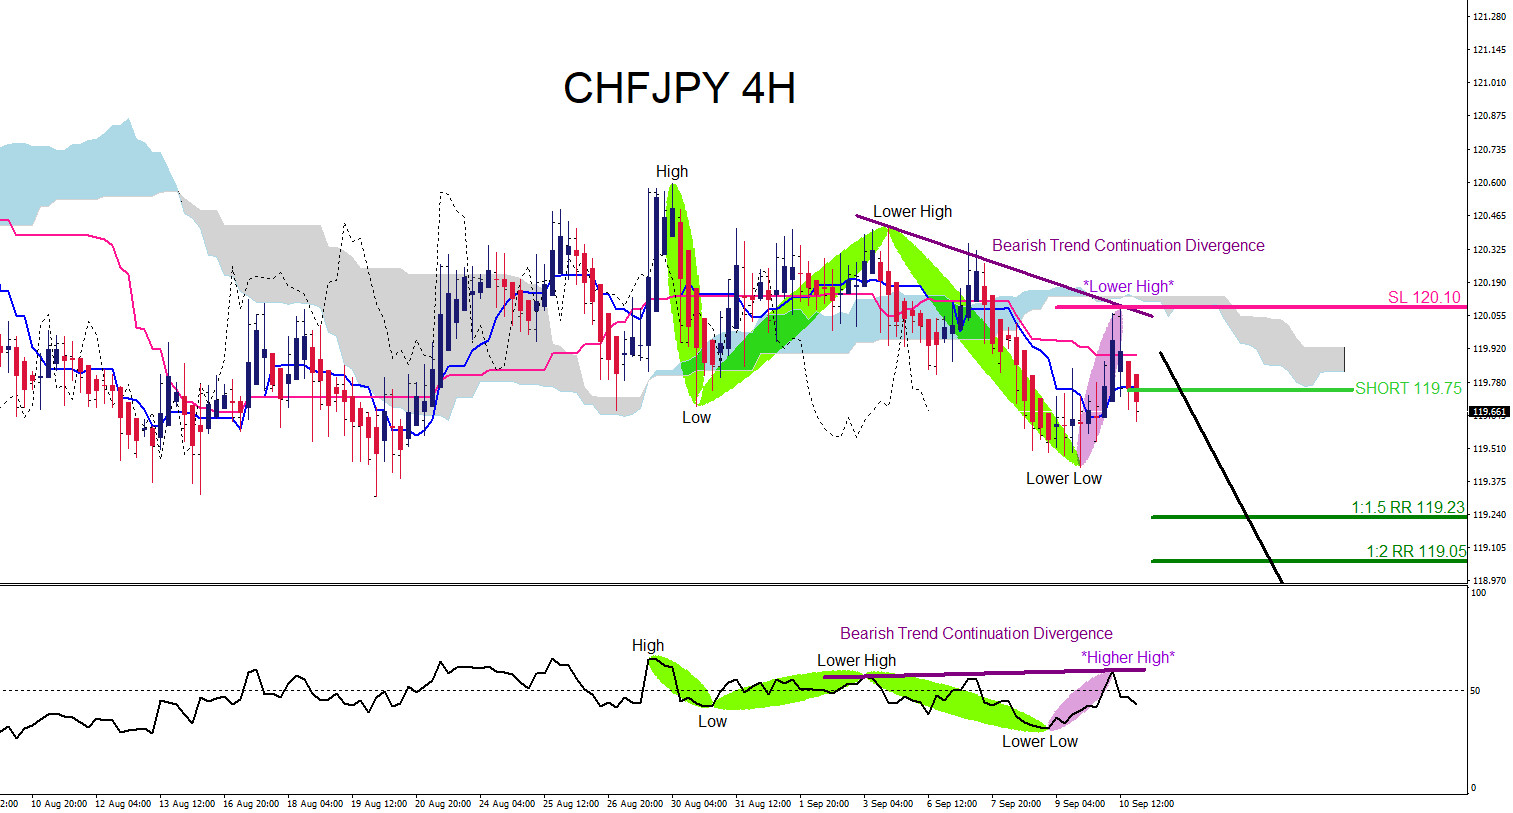
CHFJPY : Will the Pair Dip Lower?
Read MoreOn September 12 2021 I posted on social media @AidanFX “ CHFJPY for coming trading week watch for selling opportunities as long price remains below 120.10 looking for a move lower towards 119.23 – 119.05 area. “ CHFJPY can be getting ready for a possible dip lower. In the 4 hour chart below, it is visible […]