
-
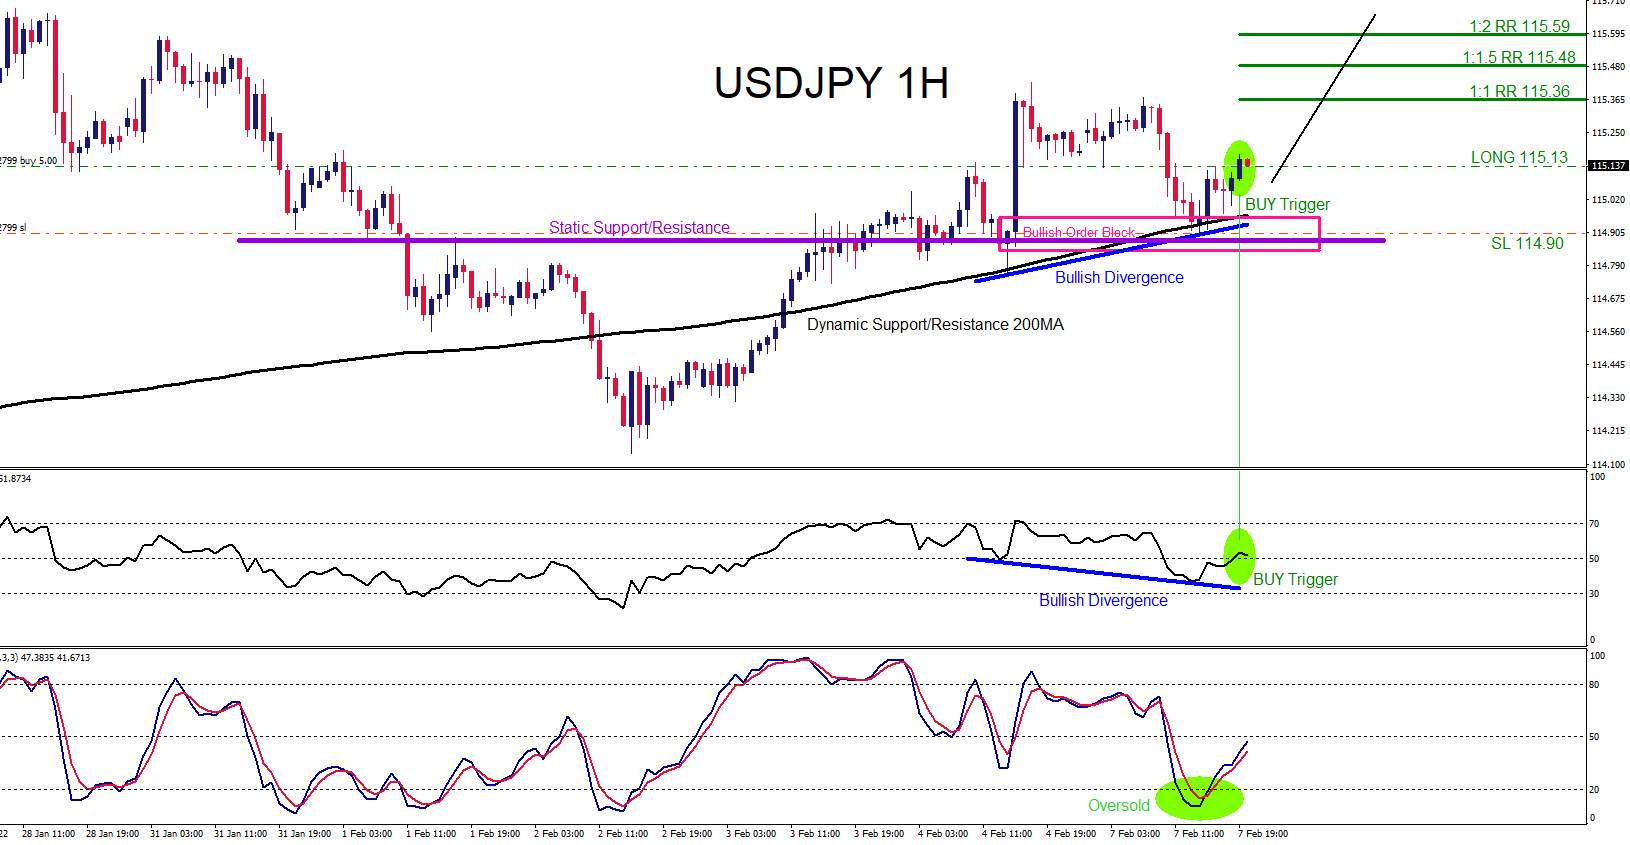
USDJPY : Trading the Move Higher
Read MoreOn February 7 2022 I posted on social media @AidanFX “ USDJPY Will be watching for BUYING opportunities for a move higher towards 115.36 – 115.59 area. Price needs to stay above 114.90 so any buying stop loss will be this level.“ Confluence trading is a combination of two or more trading strategies/techniques that come […]
-
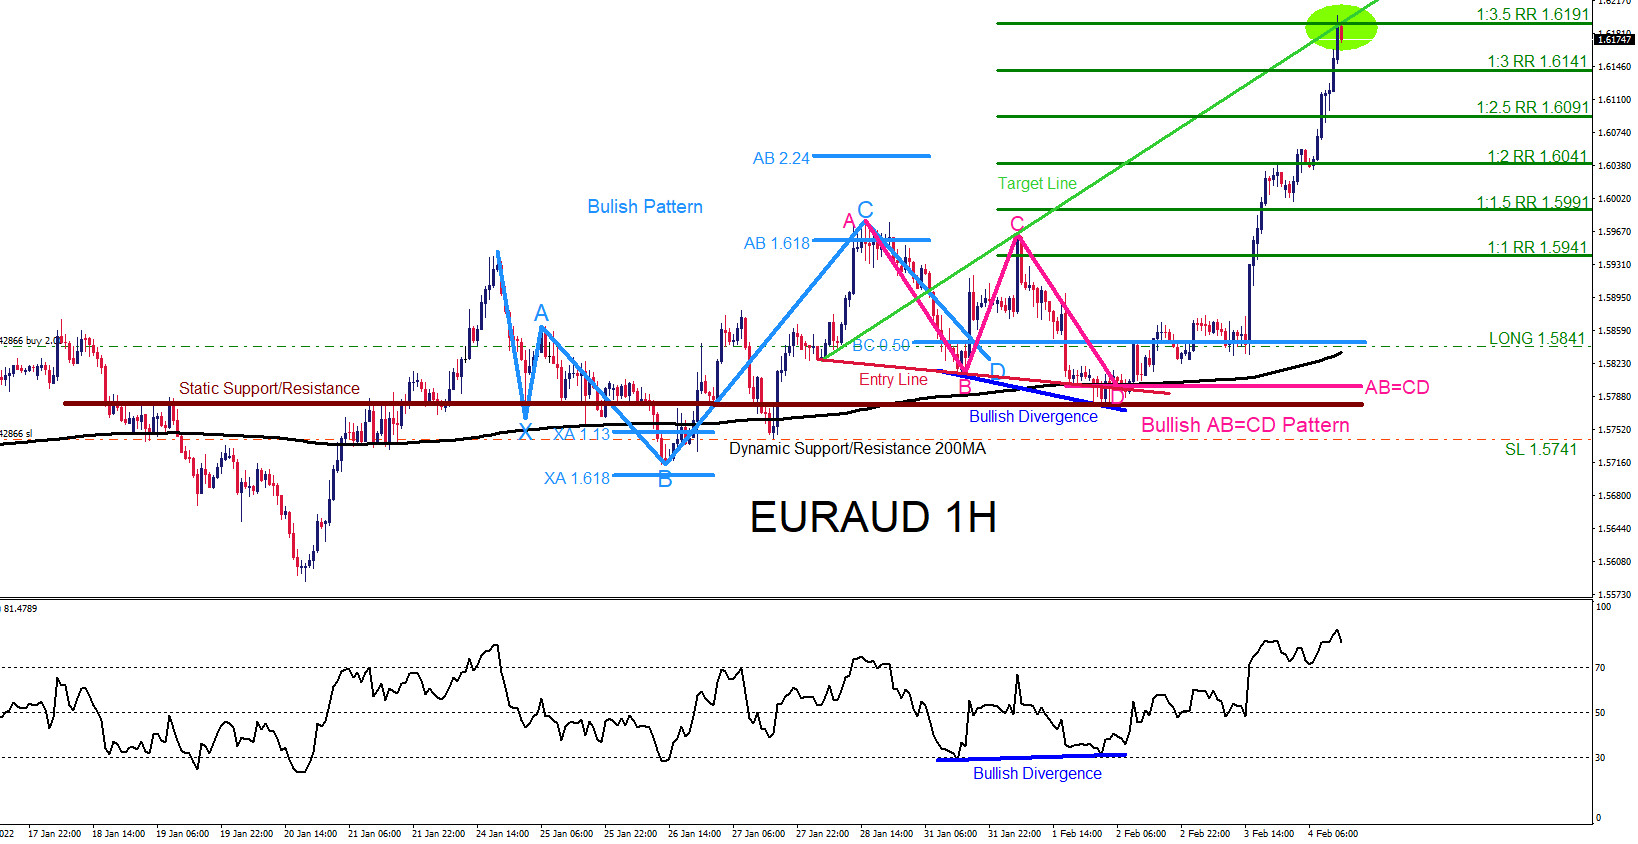
EURAUD : Trading the Move Higher
Read MoreOn January 31 2022 I posted on social media @AidanFX “ EURAUD Watch for buying opportunities as long as price stays above 1.5741.“ Confluence trading is a combination of two or more trading strategies/techniques that come together and form a high probability buy/sell zone in a certain area in the market. Market patterns (Elliott Waves, […]
-
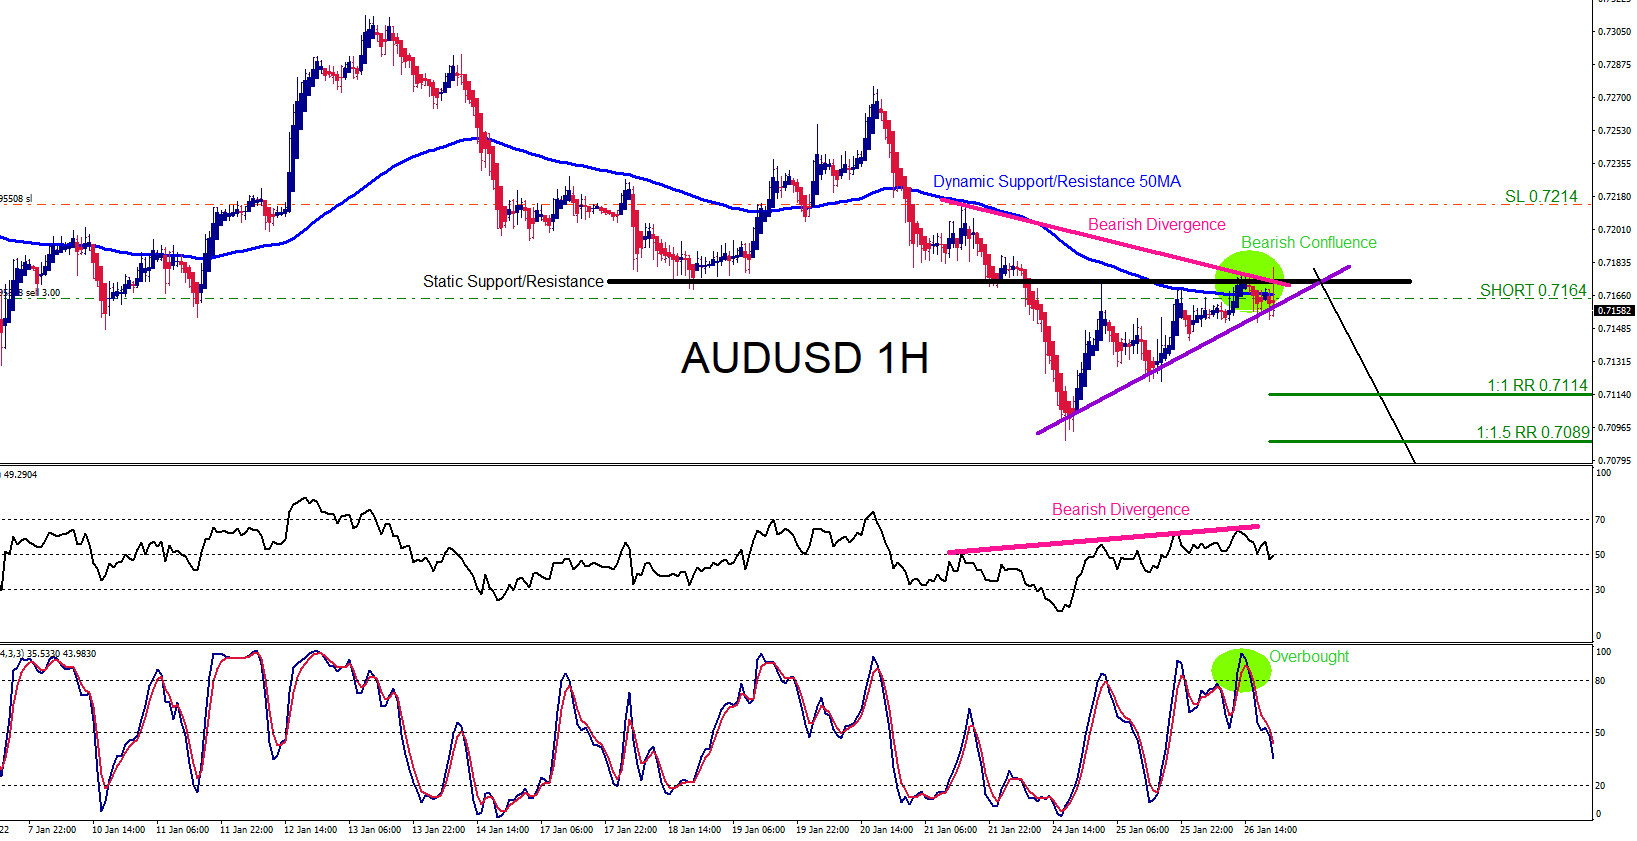
AUDUSD : Trading the Move Lower
Read MoreOn January 26 2022 I posted on social media @AidanFX the AUDUSD SELL/SHORT Trade Setup. Confluence trading is a combination of two or more trading strategies/techniques that come together and form a high probability buy/sell zone in a certain area in the market. Market patterns (Elliott Waves, Harmonic, Head and Shoulders etc.), price action analysis […]
-
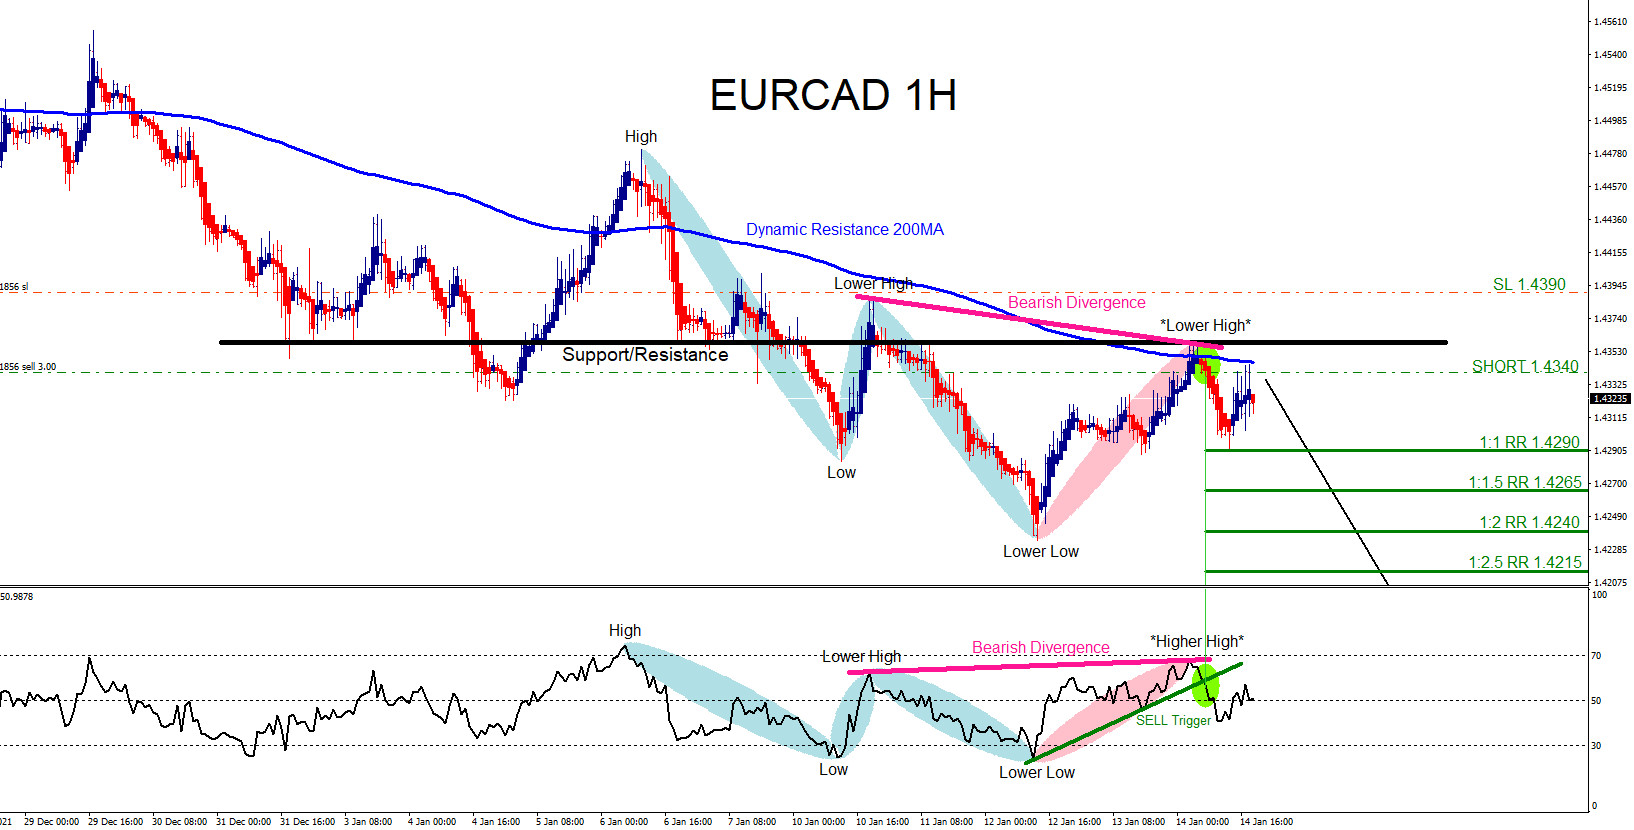
EURCAD : Trading the Move Lower
Read MoreOn January 13 2022 I posted on social media @AidanFX “ EURCAD Watch for a move lower. Watch for selling opportunities. As long as price stays below 1.4387 the pair will move lower towards the 1.4230 area.“ Confluence trading is a combination of two or more trading strategies/techniques that come together and form a high […]
-
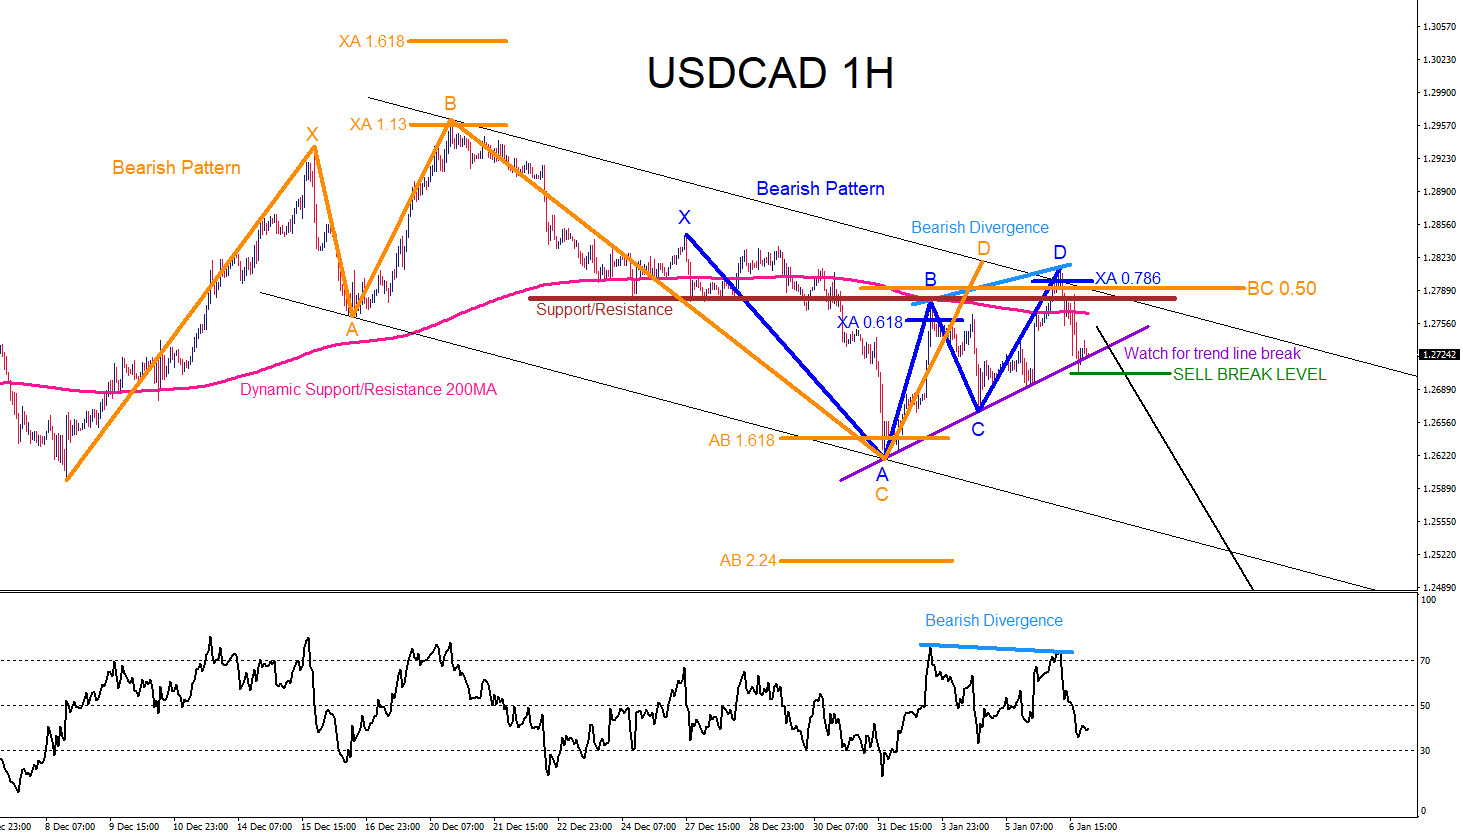
USDCAD : Market Patterns Signalled the Move Lower
Read MoreThe USDCAD 1 Hour chart below was posted on social media @AidanFX January 6 2022 showing the possible SELL scenario. Both price and RSI indicator formed a bearish divergence pattern (Light Blue) signalling a down trend continuation. Bearish market patterns, blue and orange, also terminated point D’s in the same area where the bearish divergence formed. […]
-
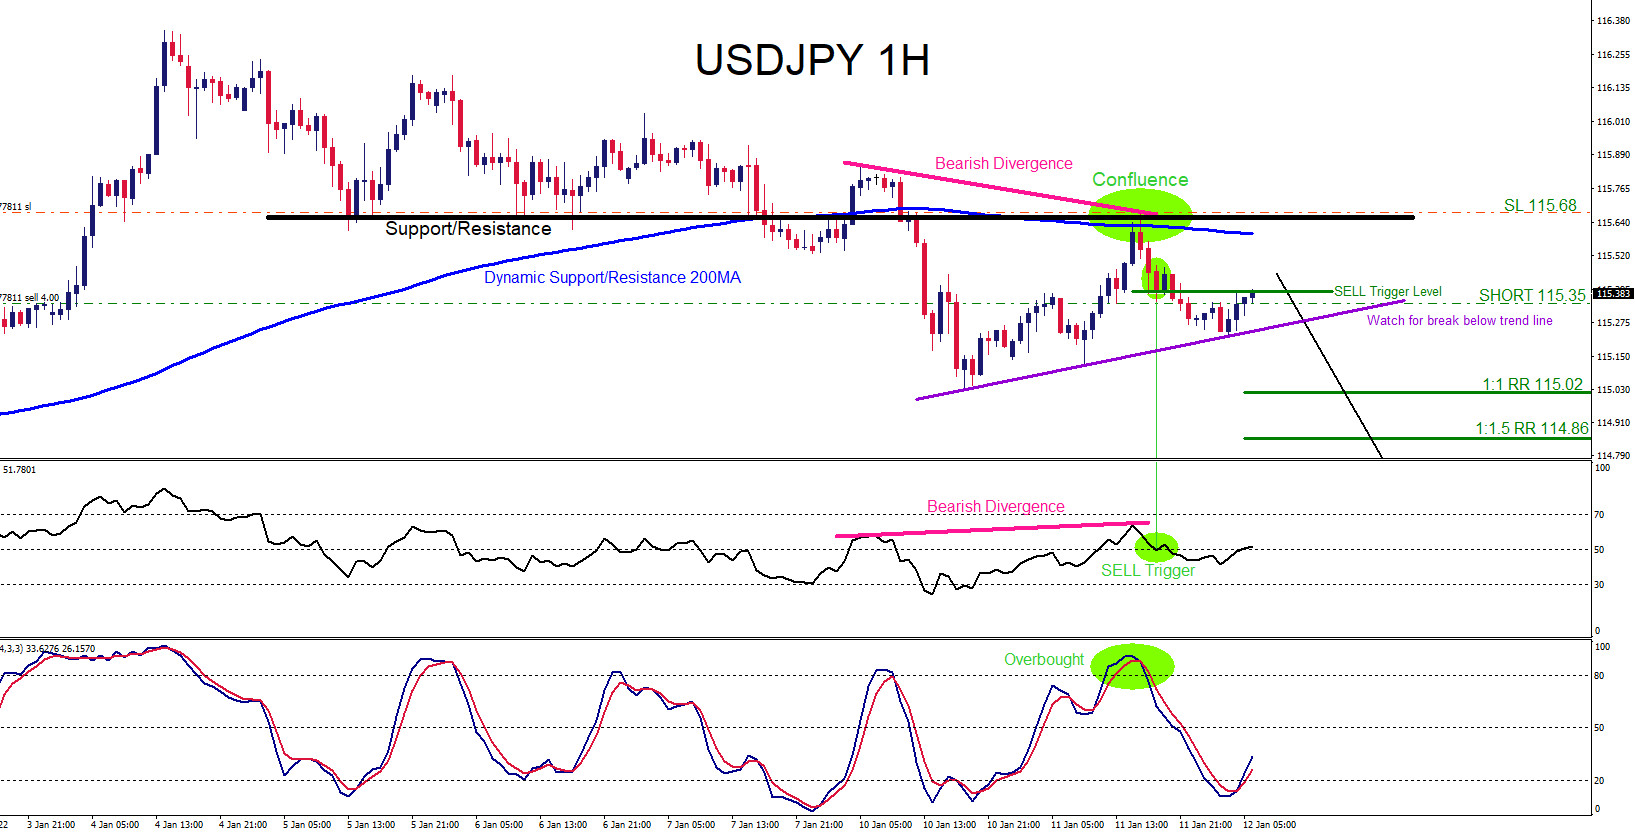
USDJPY : Trading the Move Lower
Read MoreOn January 11 2022 I posted on social media @AidanFX “ USDJPY SHORT/SELL at 115.35 SL/Stop Loss at 115.68 TP/Take Profit at the 115.02-114.85 area.“ Confluence trading is a combination of two or more trading strategies/techniques that come together and form a high probability buy/sell zone in a certain area in the market. Market patterns […]