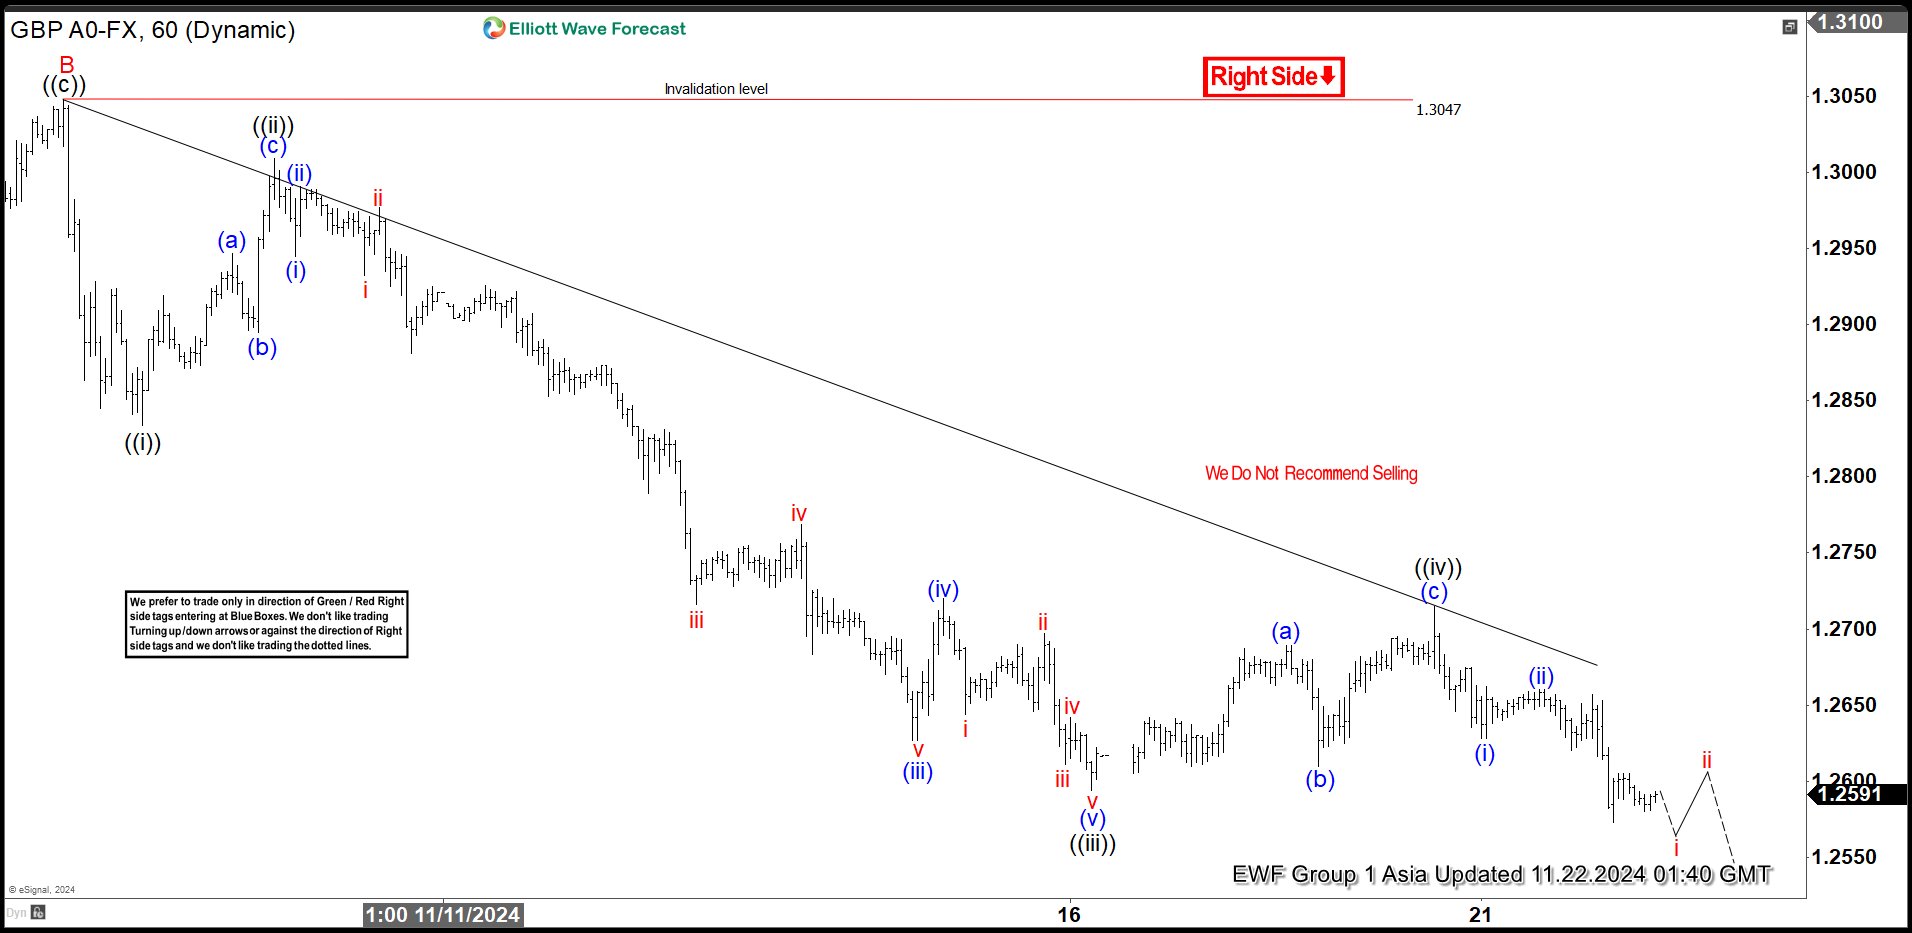
Short Term Elliott Wave View in GBPUSD suggests decline from 9.26.2024 high is in progress as a zigzag structure. Down from 9.26.2024 high, wave A ended at 1.284. Wave B bounce ended at 1.3047 as the 1 hour chart below shows. Wave C lower is now in progress with internal subdivision as a 5 waves impulse Elliott Wave structure. Down from wave B, wave ((i)) ended at 1.283 and wave ((ii)) ended at 1.3. Pair then resumed lower in wave ((iii)). Down from wave ((ii)), wave (i) ended at 1.294 and rally in wave (ii) ended at 1.3.
Pair resumed lower in wave (iii) towards 1.2627 and wave (iv) rally ended at 1.272. Wave (v) lower ended at 1.2594 which completed wave ((iii)) in higher degree. Rally in wave ((iv)) unfolded as a zigzag structure. Up from wave ((iii)), wave (a) ended at 1.2689 and pullback in wave (b) ended at 1.261. Wave (c) higher ended at 1.2715 which completed wave ((iv)) in higher degree. Wave ((v)) of C lower is now in progress with potential target 100% – 161.8% of wave A. This area comes at 1.208 – 1.245 where buyers can appear for 3 waves rally at least.


