Chevron is a major global energy company involved in oil and gas exploration, production, refining, and marketing. Operating in over 180 countries, the company emphasizes sustainability, innovation, and corporate responsibility, with a focus on maintaining substantial energy reserves and addressing environmental concerns.
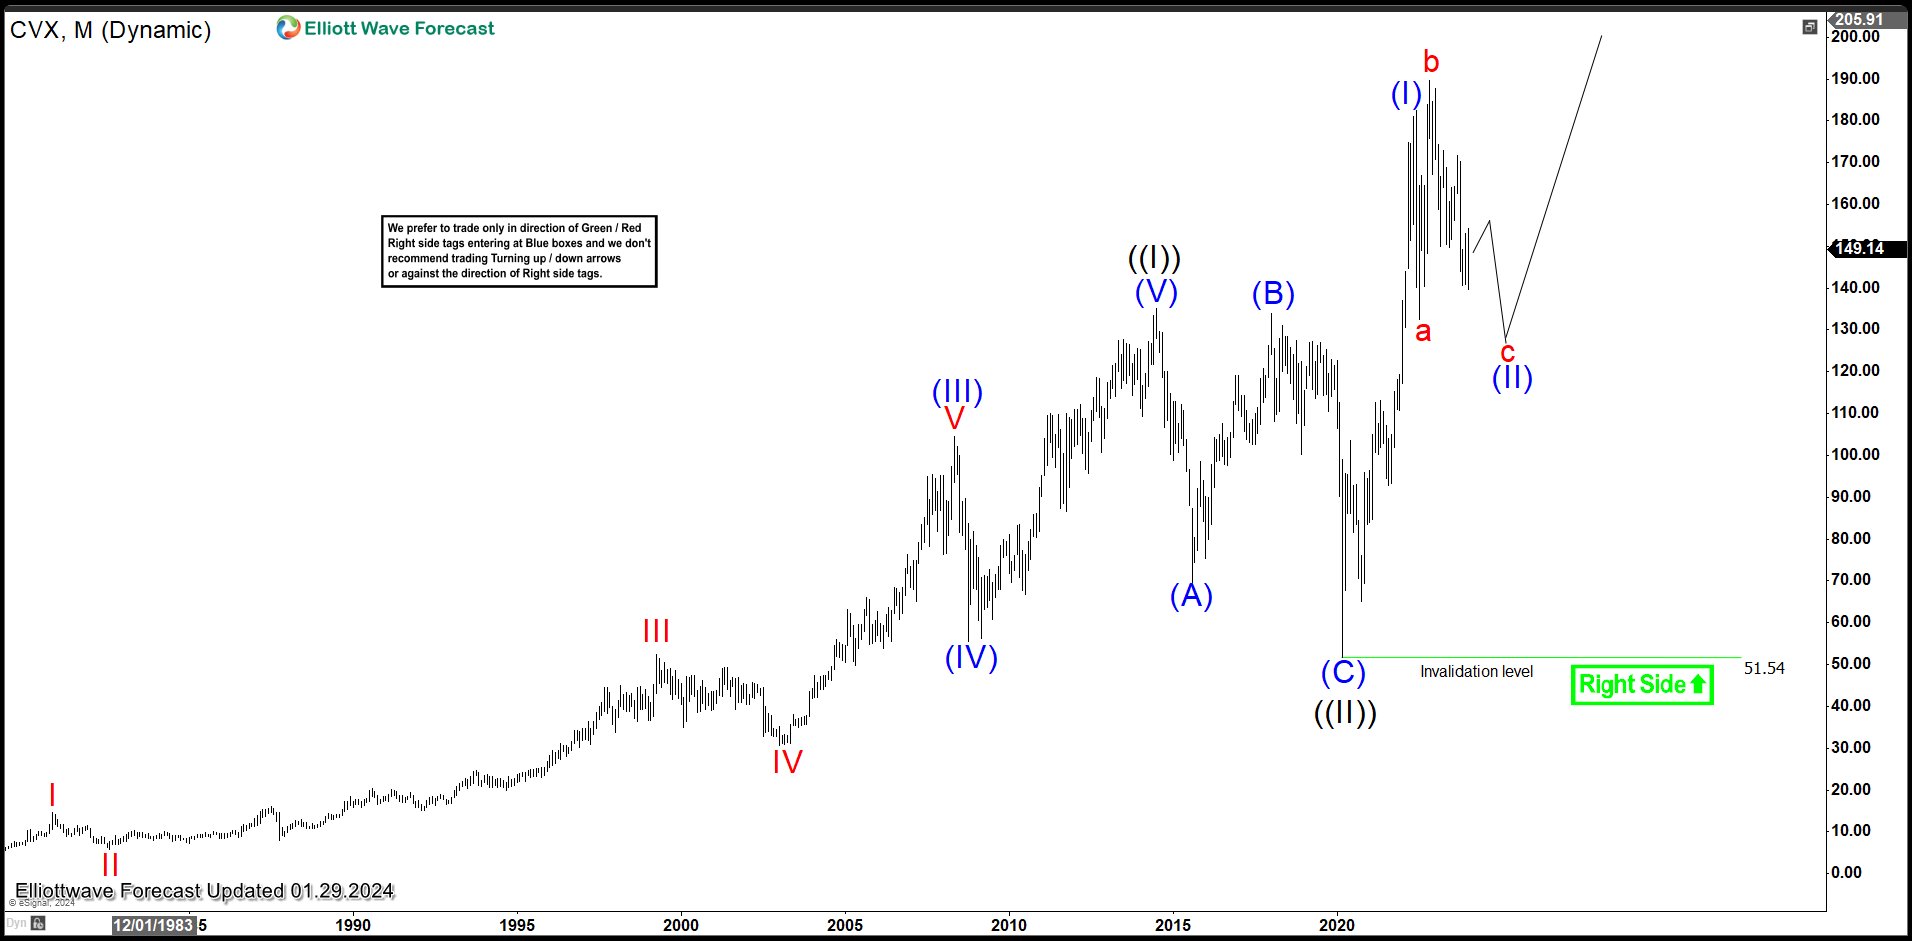
Chevron Monthly Elliott Wave Chart
Monthly Elliott Wave chart of Chevron (CVX) above shows that the stock has traded sideways since making all time high on November 14, 2022 at 189.68. It’s currently pulling back in wave (II) to correct cycle from 3.19.2020 low as an expanded flat Elliott Wave structure. Rally from 3.19.2020 low ended wave (I) at 182.4. Down from there, wave a ended at 132.54 and wave b ended at 189.68. Wave c lower is in progress as a 5 waves. Down from wave b, wave ((1)) ended at 149.74 and wave ((2)) ended at 171.7. Wave ((3)) lower ended at 140.92. Expect wave ((4)) rally to fail and then stock to do another leg wave ((5)) to end wave c of (II) before the rally resumes. As far as pivot at 51.97 low stays intact, the stock should see further upside again once wave (II) correction is over.
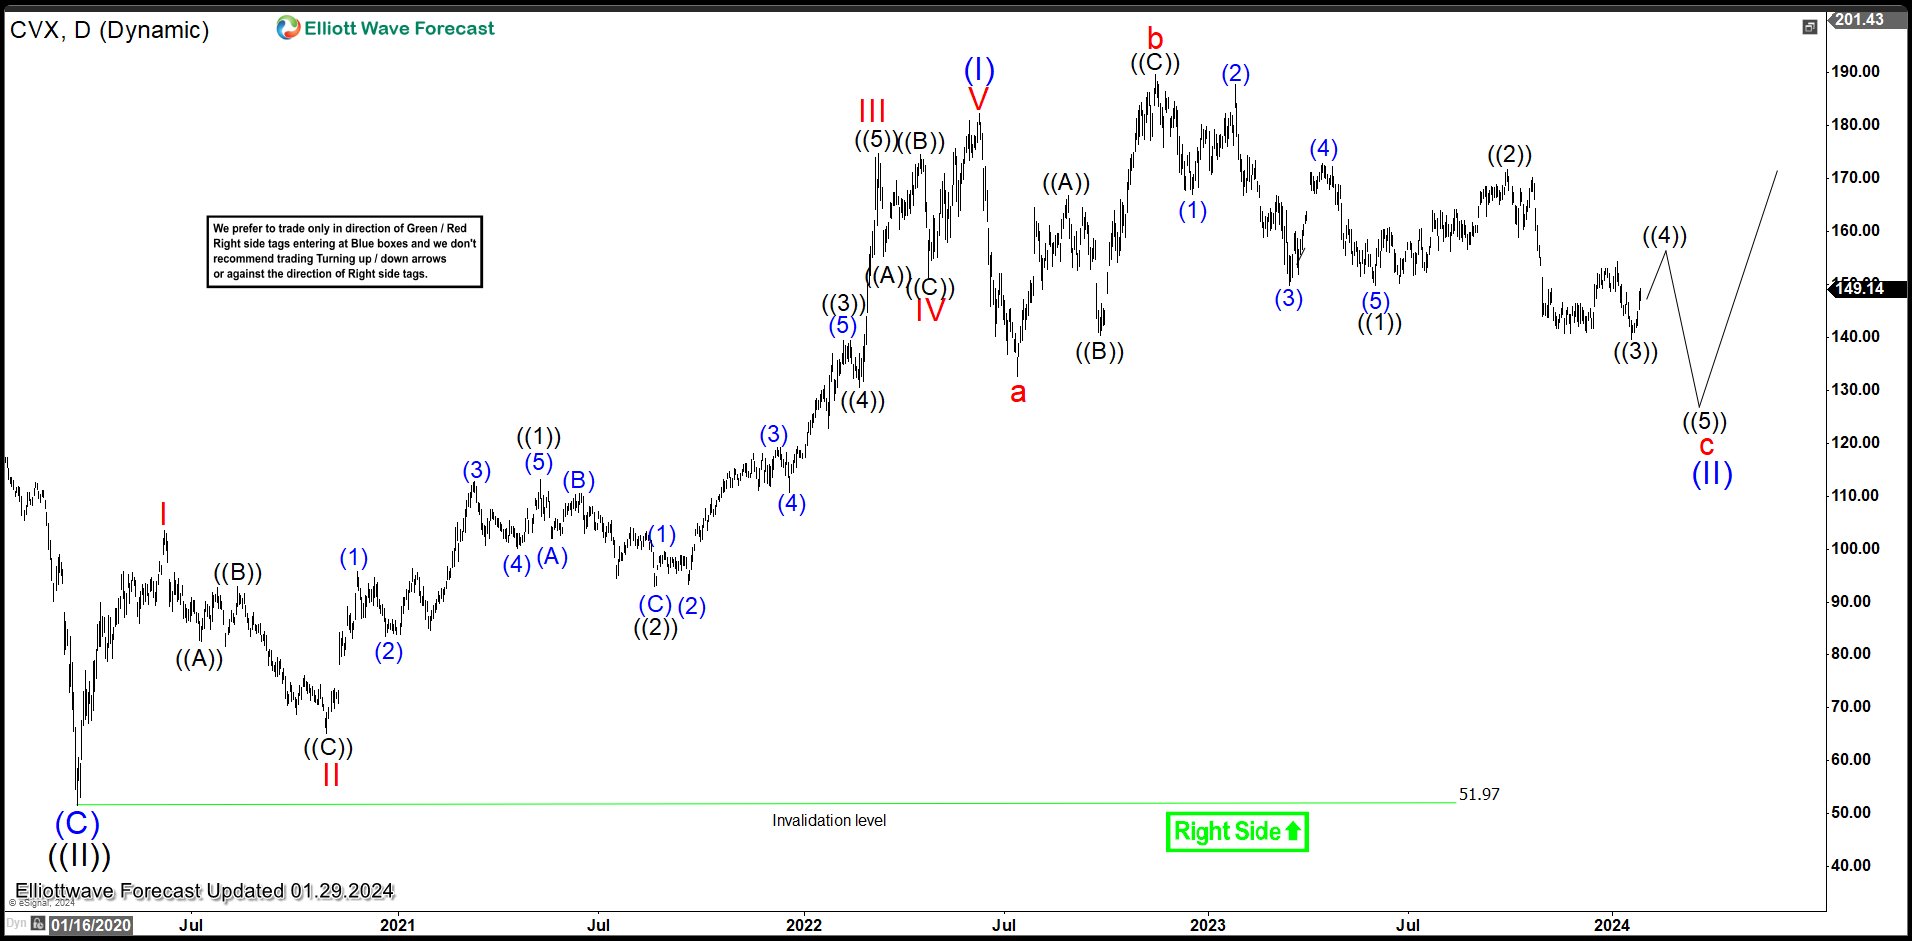
Chevron Daily Elliott Wave Chart
Daily Elliott Wave view in Chevron above shows wave c of (II) Expanded Flat is in progress as a 5 waves diagonal. Down from wave b, wave ((1)) ended at 149.74 and wave ((2)) ended at 171.7. Wave ((3)) lower ended at 139.62. Wave ((4)) rally is currently in progress but another leg lower can’t be ruled out to finish wave ((5)). This should complete wave c of (II), then the stock can resume higher again.
If you’d like to get regular updates on other stocks, ETF, forex, and commodities, feel free to take our trial here –> 14 days Trial
Back


