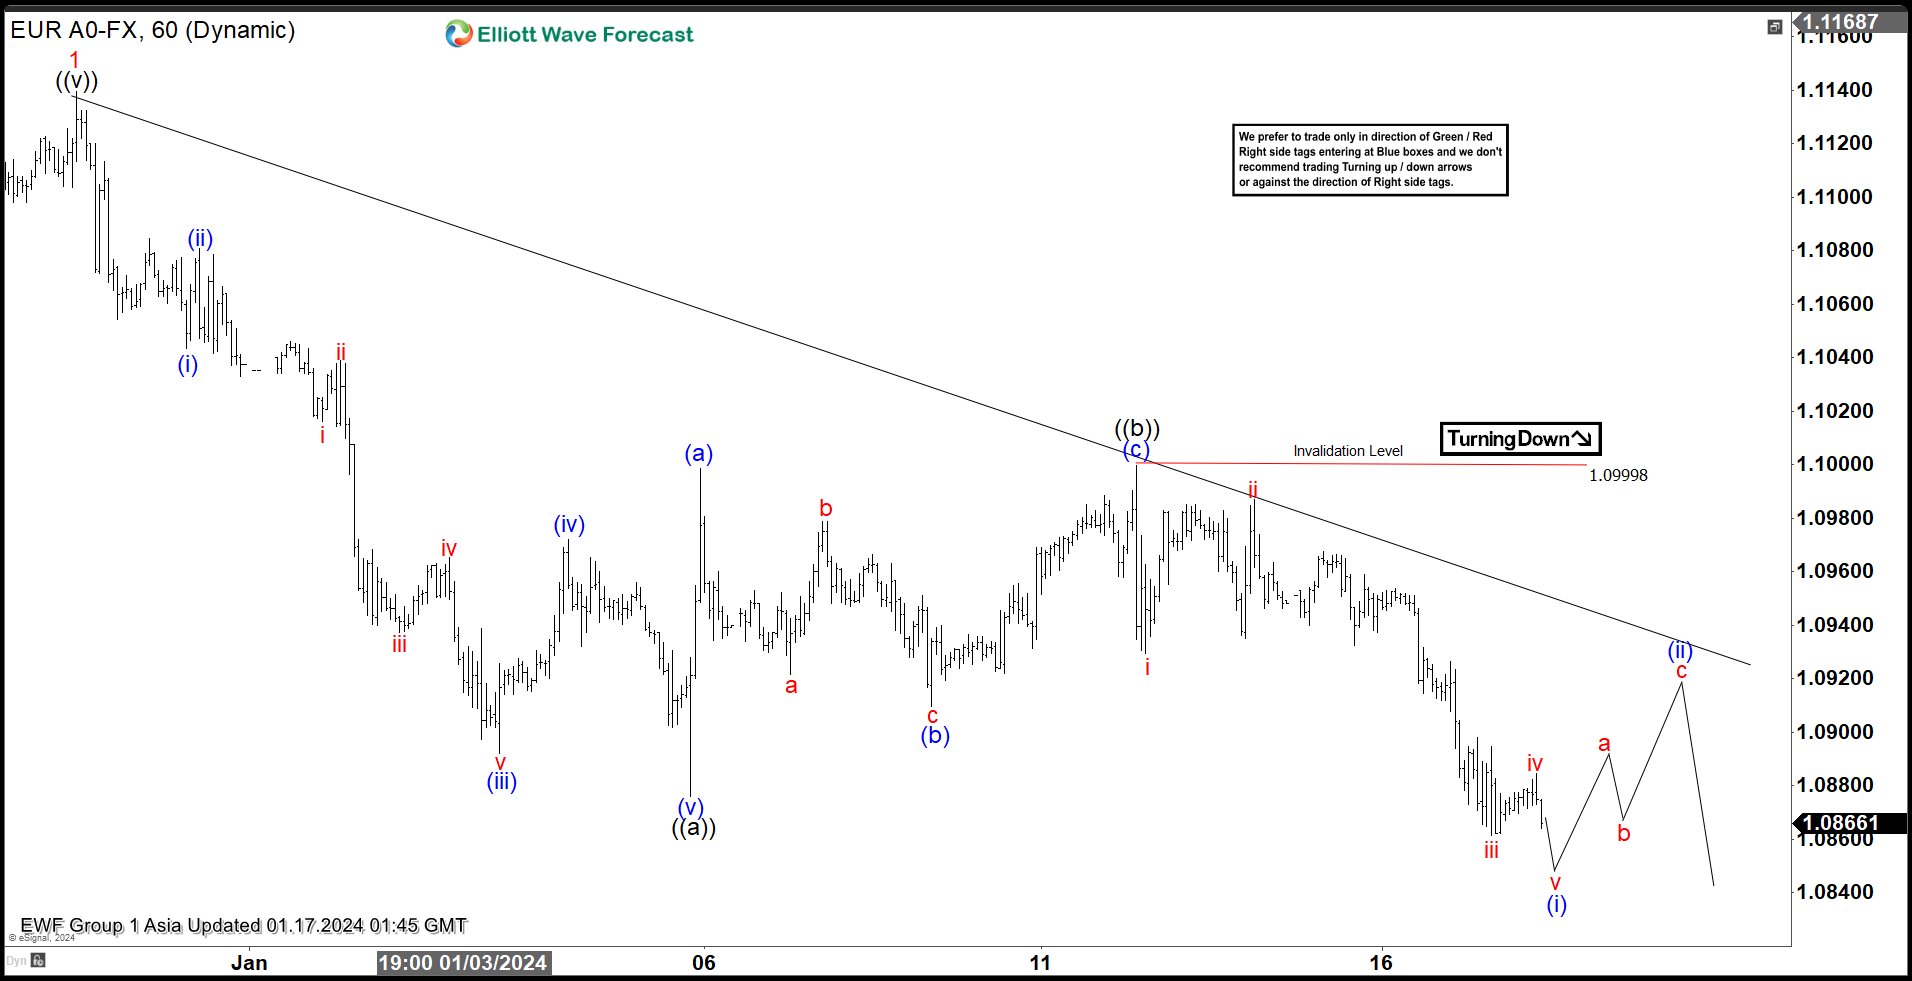
Short term Elliott Wave View suggests $EURUSD ended wave 1 rally at 1.11395. Pair is now doing wave 2 pullback to correct cycle from 10.03.2023 low. Wave 2 subdivides into a zigzag Elliott Wave structure. Zigzag is a 5-3-5 structure with ABC as the label. Wave A and C in zigzag subdivide into 5 waves as the chart of EURUSD shows. Down from wave 1, wave (i) ended at 1.10434 and rally in wave (ii) ended at 1.10808. Pair then resumes lower in wave (iii) towards 1.0892 and wave (iv) rally ended at 1.0972. Final leg down wave (v) ended at 1.0876 which completed the first leg of the zigzag wave ((a)).
Wave ((b)) rally ended at 1.1 with internal subdivision as a zigzag in lesser degree. Up from wave ((a)), wave (a) ended at 1.0999, wave (b) ended at 1.0909, and wave (c) higher ended at 1.099. This completed wave ((b)) in higher degree. Pair has resumed lower in wave ((c)). Down from wave ((b)), wave i ended at 1.0929 and wave ii ended at 1.0987. Wave iii lower ended at 1.08729 and wave iv ended at 1.0898. Expect wave v lower to end soon which should complete wave (i). Pair should then rally in wave (ii) to correct cycle from 1.11.2024 high in 3, 7, or 11 swing before pair resumes lower. Near term, as far as pivot at 1.099 high stays intact, expect rally to fail in 3, 7, 11 swing for further downside.


