Eli Lilly & Company (LLY) discovers, develops & markets human pharmaceuticals worldwide. It is having around 550 B market cap as on December, 18th. It is based in Indianapolis, Indiana, US, comes under Healthcare sector & trades as “LLY” ticket at NYSE.
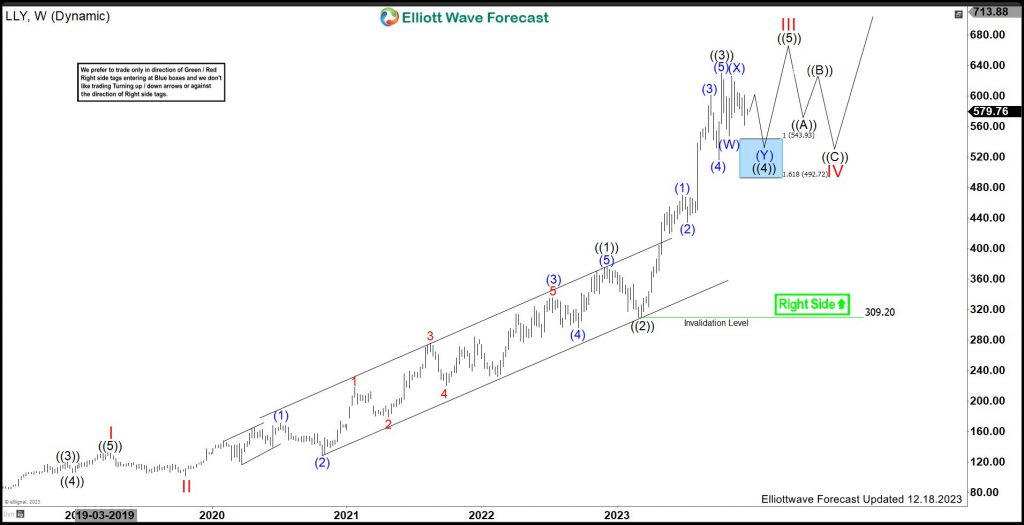
LLY reacted higher as expected from the previous article, in ((3)) towards $584.39 or higher levels. It ended ((3)) of III at $629.97 high & favors double correction in ((4)) before rally resumes.
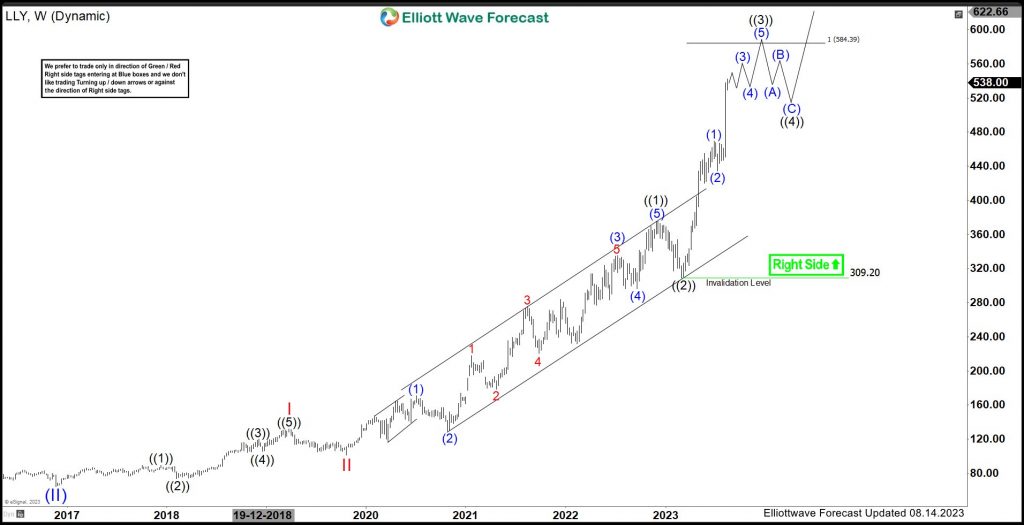
LLY – Elliott Wave Weekly View From 8.14.2023: 
In Weekly sequence, it finished (I) at $92.85 high in September-2015 & (II) at $64.18 low in November-2016. Above there, it favors higher in (III) of ((III)), in which it placed I at $132.13 high & II at $101.36 low. It favors higher in third wave extension in III & expect pullback in ((4)) before rally resumes in ((5)). It placed ((1)) at $375.25 high & ((2)) at $309.20 low. Within ((1)), it finished (1) at $170.75 as diagonal structure & (2) at $129.21 low as 0.618 Fibonacci retracement. It placed (3) at $335.33 high, (4) at $296.32 low & (5) at $375.25 high.
LLY – Elliott Wave Latest Weekly View: 
It ended ((3)) of III at $629.97 high in III. Within ((3)), it placed (1) at $469.87 high, (2) at $434.34 low, (3) at $601.84 high, (4) at $516.57 low & finally (5) as ((3)) at $629.97 high. Currently, it favors pullback in ((4)) as double correction & expect choppiness. It placed (W) at $547.61 low and (X) at $625.87 high. Below there, it favors lower in (Y) of ((4)) towards $543.93 – $492.72 area as blue box. It expects to find the buyers from the blue box area to resume upside in ((5)) to finish III of (III).
Elliottwave Forecast updates 1-hour charts four times a day & 4-hour charts once a day for all our 78 instruments. We do a daily live session, where we guide our clients on the right side of the market. In addition, we have a chat room where our moderators will help you with any questions you have about what is happening in the market at the moment. You can try us for 14 days for only $9.99.
Back
