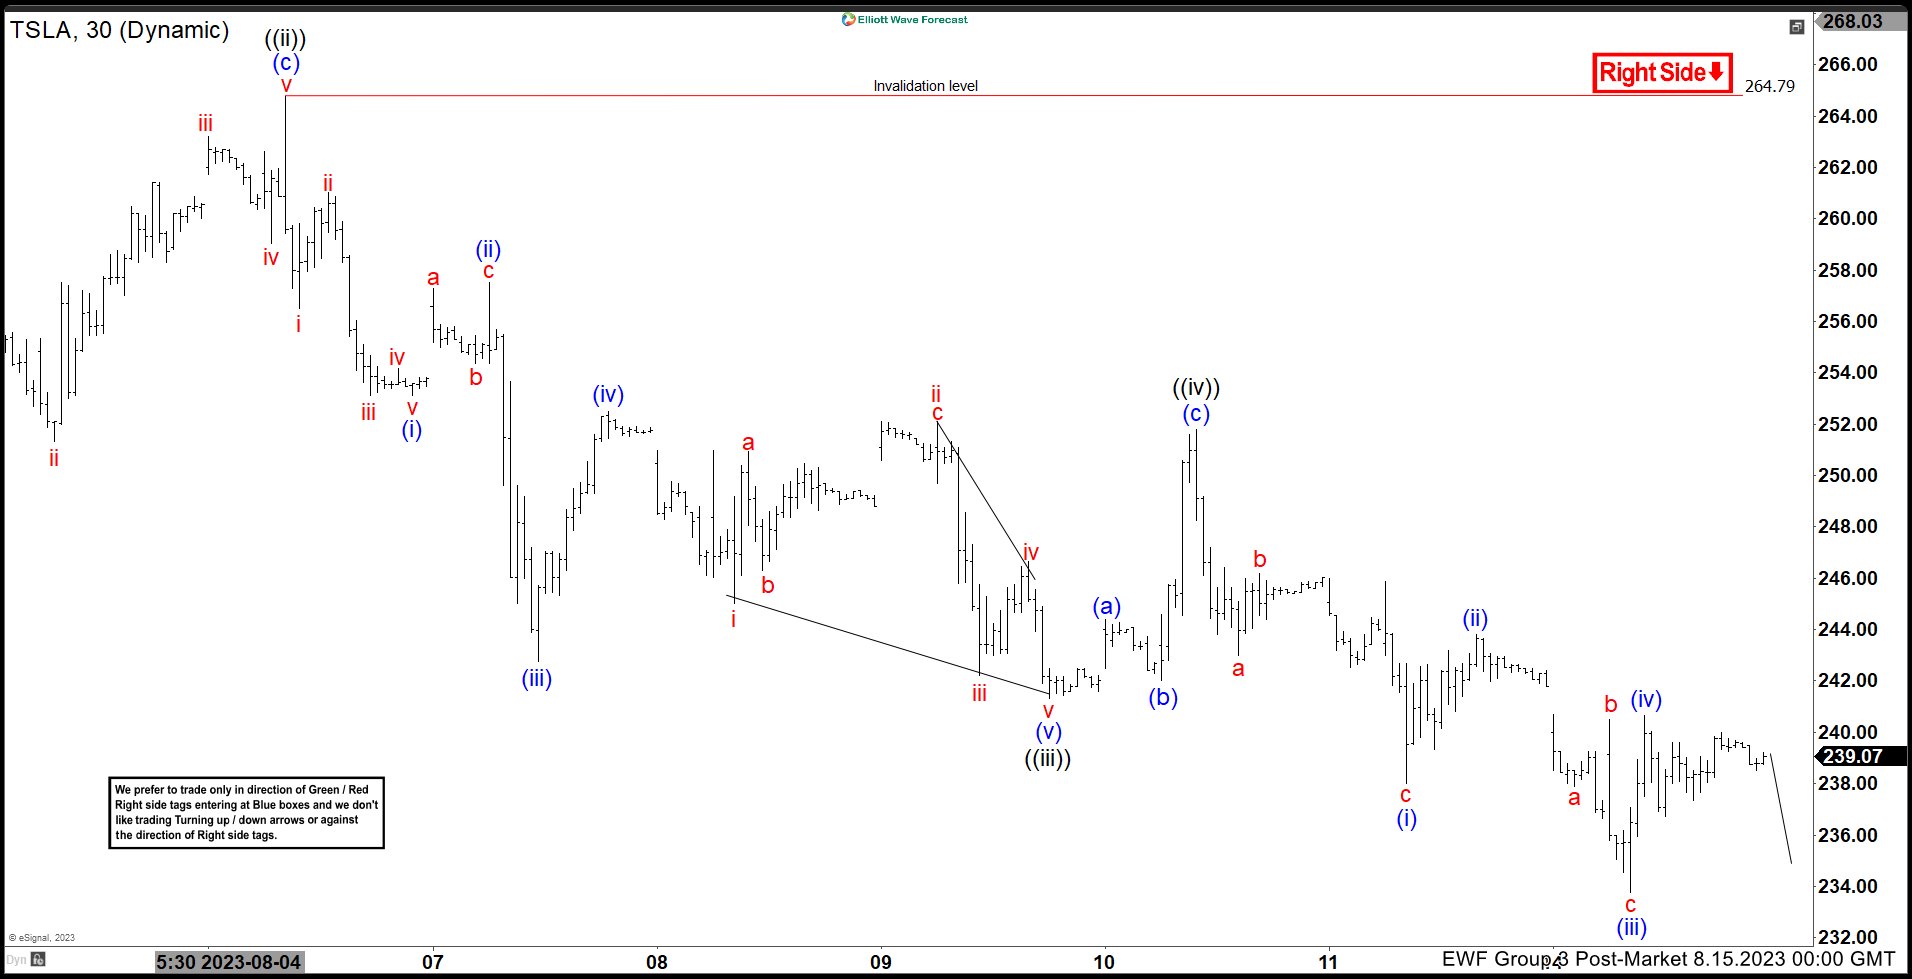
Tesla (TSLA) cycle from July 19, 2023 high remains in progres. The cycle has a 100% – 161.8% Fibonacci extension area target of 198.9 – 227.6. Near term, cycle from July 31 high is in progress as an impulse Elliott Wave structure. Down from July 31 high, wave ((i)) ended at 250.49 and wave ((ii)) rally ended at 264.79 as the 30 minutes chart below shows. The stock then extended lower in wave ((iii)). Down from wave ((ii)), wave (i) ended at 253.1 and rally in wave (ii) ended at 257.5. Wave (iii) lower ended at 242.76 and wave (iv) ended at 252.48. Final wave (v) ended at 241.32 which completed wave ((iii)).
Rally in wave ((iv)) ended at 251.80 with internal subdivision as a zigzag Elliott Wave structure. Up from wave ((iii)), wave (a) ended t 244.4, pullback in wave (b) ended at 242, and wave (c) higher ended at 251.80 which also completed wave ((iv)). The stock has resumed lower in wave ((v)) with internal subdivision as an impulse. Down from wave ((iv)), wave (i) ended at 238.02, and rally in wave (ii) ended at 243.79. Wave (iii) lower ended at 233.75, and wave (iv) ended at 240.65. Near term, as far as pivot at 264.79 high stays intact, expect rally to fail in 3, 7, or 11 swing for further downside.


