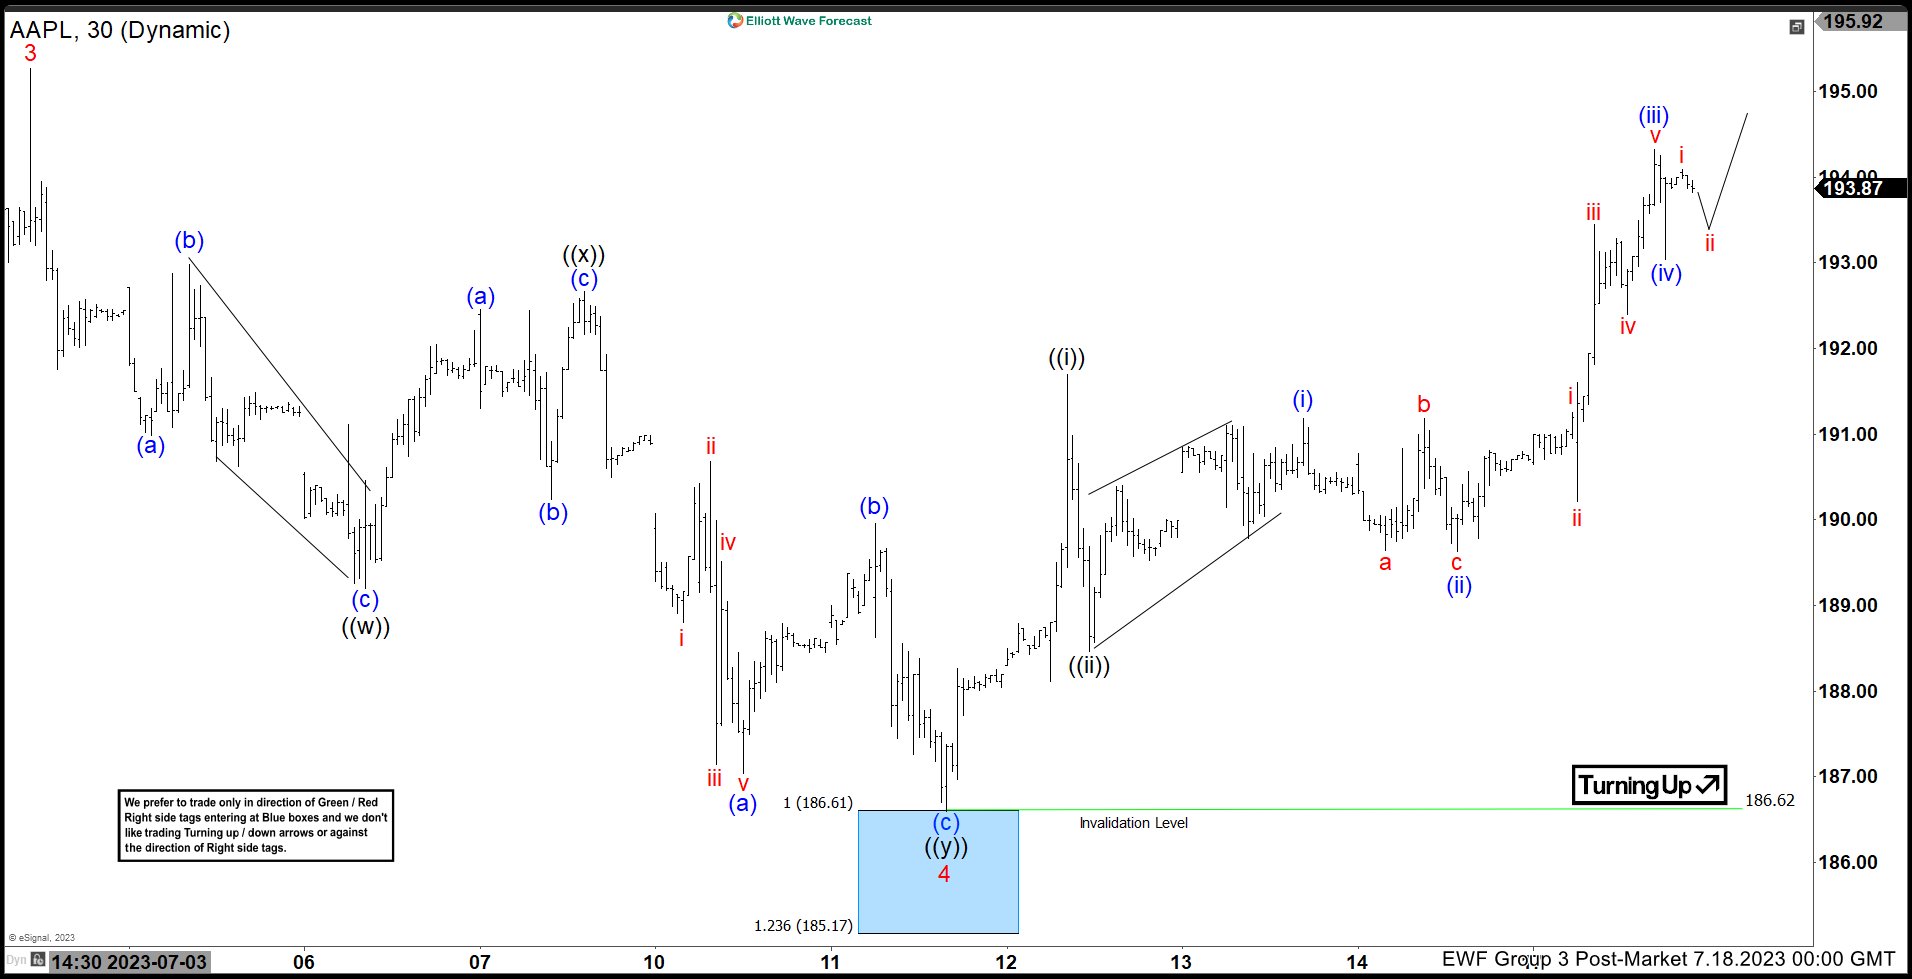
Short term view in Apple (ticker: AAPL) suggests the rally from 3.29.2023 low is in progress as a 5 waves impulse Elliott Wave structure. Up from 3.29.2023 low, wave 1 ended at 167 and pullback in wave 2 ended at 159.70. The stock resumed higher in wave 3 towards 195.27 as the 1 hour chart below shows. Down from there, wave 4 unfolded as a double three structure. Down from wave 3, wave (a) ended at 190.99 and wave (b) ended at 192.98. Wave (c) lower ended at 189.20 which completed wave ((w)). Rally in wave ((x)) ended at 192.67 with internal subdivision as a zigzag. Up from wave ((w)), wave (a) ended at 192.46, wave (b) ended at 190.24, and wave (c) higher ended at 192.67 which completed wave ((x)).
The stock resumed lower in wave ((y)). Down from wave ((x)), wave (a) ended at 187.04 and wave (b) ended at 189.96. Final leg wave (c) ended at 186.62 which completed wave ((y)) of 4 at the 100% – 161.8% Fibonacci extension area of wave ((w)). The stock has resumed higher in wave 5. Up from wave 4, wave ((i)) ended at 191.7 and pullback in wave ((ii)) ended at 188.47. Wave ((iii)) still remains in progress and should complete with 1 more push higher. Near term, as far as pivot at 186.62 low stays intact, expect pullback to find support in 3, 7, 11 swing and stock to extend higher.


