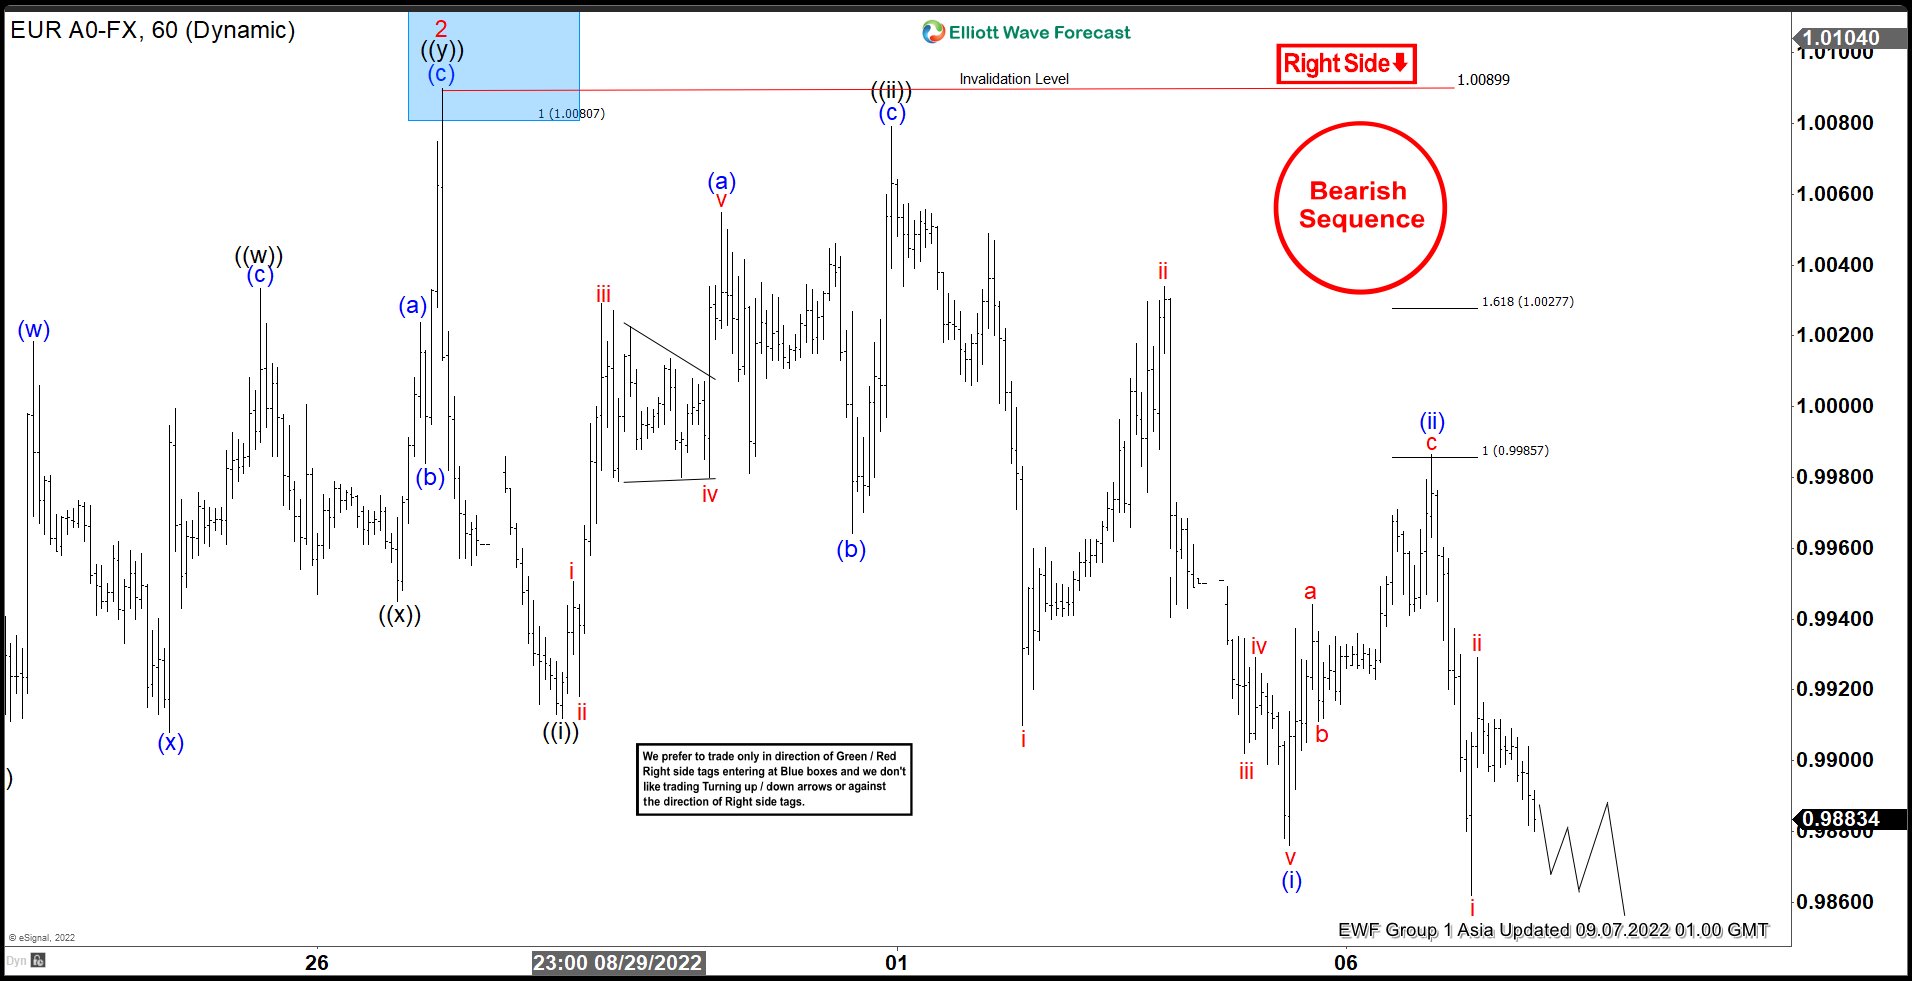
EURUSD shows a bearish sequence from 8.10.2022 high suggesting further downside is likely. The decline from August 10 high is unfolding as an impulse Elliott Wave structure. Down from August 10 high, wave 1 ended at 0.9899 and rally in wave 2 ended at 1.009 as the 1 hour chart below shows. Pair has resumed lower in wave 3 which subdivides into another impulse in lesser degree.
Down from wave 2, wave ((i)) ended at 0.9912 and rally in wave ((ii)) ended at 1.0079. Internal subdivision of wave ((ii)) took the form of a zigzag. Up from wave ((i)), wave (a) ended at 1.0055, wave (b) ended at 0.9973 and wave (c) of ((ii)) ended at 1.0079. Pair then turned lower in wave ((iii)). Down from wave ((ii)), wave (i) ended at 0.9876 and wave (ii) ended at 0.9986. Pair turned lower again in wave (iii) of ((iii)). Down from wave (ii), wave i ended at 0.9862 and wave ii ended at 0.9929. Near term, as far as pivot at 1.009 high stays intact, expect rally to fail in 3, 7, or 11 swing for further downside. Potential target lower is 100% – 161.8% Fibonacci extension from 8.10.2022 peak at 0.933 – 0.962.


