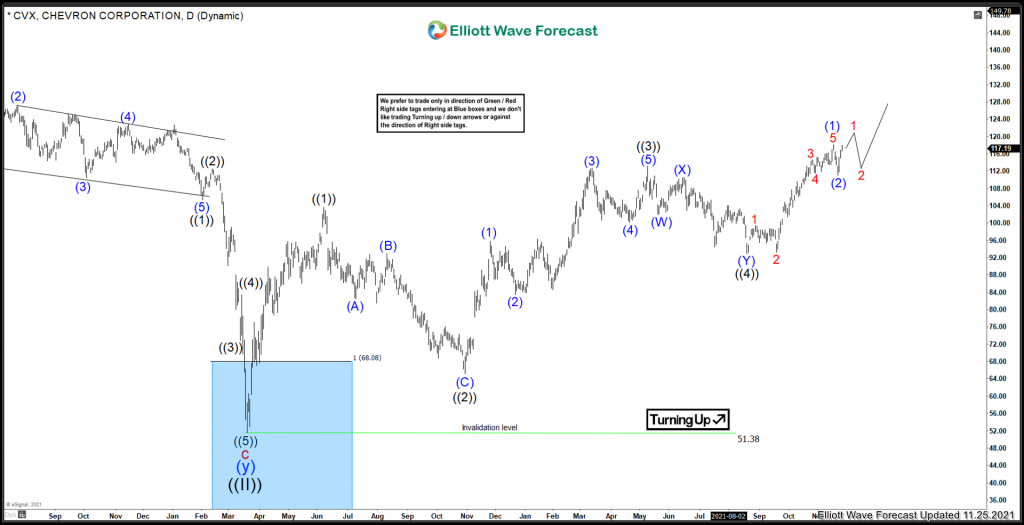
The last time I Chevron was back in November 2021 (you can view this article here). The energy Industry has been impulsive and bullish since the low struck at the March 2020 low. In my previous view I was looking for a 5th wave off the 2020 low to take place before pulling back to correct that low. Lets take a look at the chart below:
Chevron Elliottwave View November 2021:
In November 2021, as mentioned, I was looking for further extension higher in Chevron. At the time there was some momentum divergence to suggest that the cycle from the 2020 low was close to coming to an end. Extension higher did take place, but ended up giving more bullish momentum than was expected. Lets take a look at the current view, and what momentum is suggesting for Chevron.
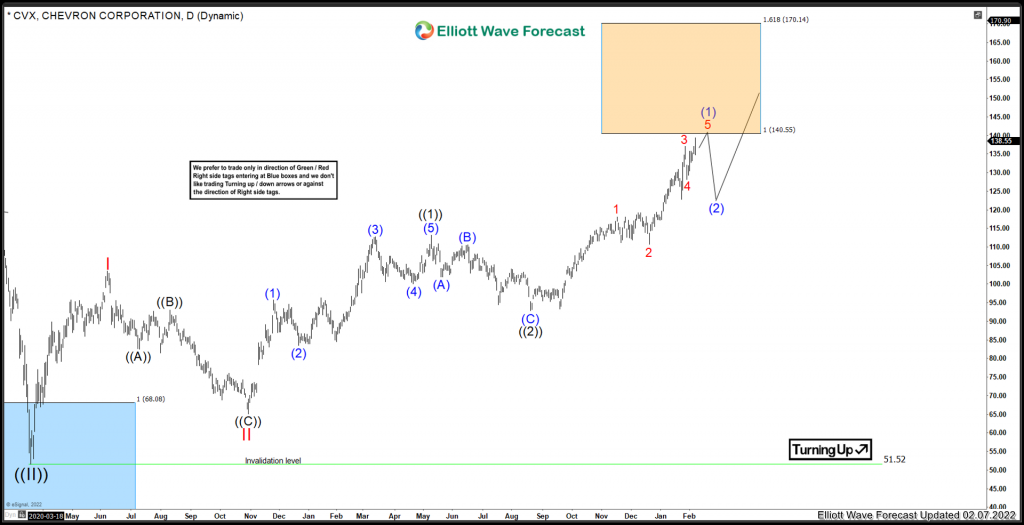
Chevron Elliottwave View Feb 2022:
Since the October 2020 low in Chevron, the count is looking very bullish. Momentum is suggesting that the instrument is nesting before moving higher in a wave 3 of 3 advance. There is an area above that can be an area where another pullback can take place. The 140.55 to 170.14 area is the 100% – 161.8% extension area for the black ((3)) area to possibly peak. Ideally, ((3)) will extend higher to the 170.14 161.8% extension. Due the idea that this instrument is nesting with a possible triple nest (after blue (2) retraces) it is possible higher extension takes place than anticipated for ((3)). For now, another nest in (2) is expected to take place before the next rally higher.
Risk Management
Using proper risk management is absolutely essential when trading or investing in a volatile stocks. Elliott Wave counts can evolve quickly, be sure to have your stops in and define your risk when trading.
Improve your trading success and master Elliott Wave like a pro with our 14 day trial today. Get Elliott Wave Analysis on over 70 instruments. Including stocks like GOOGL, TSLA, AAPL, FB, MSFT and many many more.
Back


