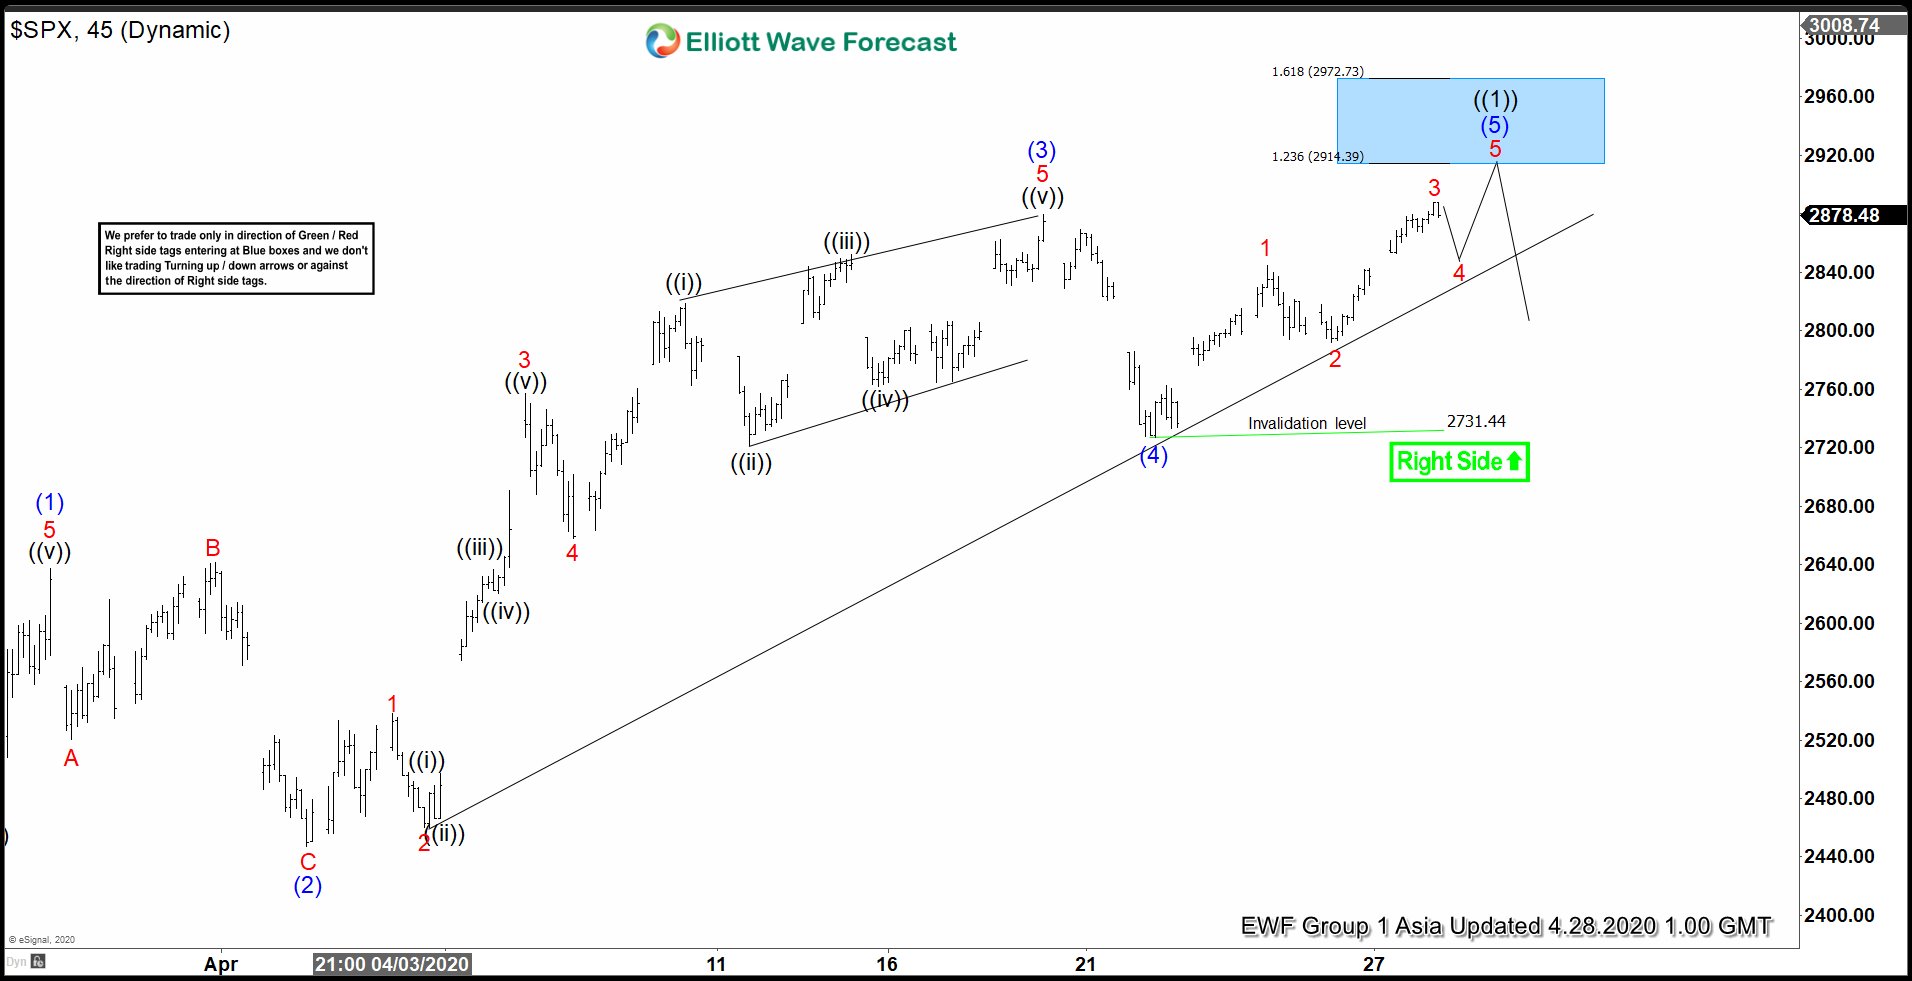
Short Term Elliott Wave view suggests that the rally in $SPX from March 23 low is unfolding as a 5 waves impulsive Elliott Wave structure. Up from 3.23.2020 low, wave (1) ended at 2637.01 and wave 2 pullback ended at 2447.49. In the chart below, we can see the subdivision of wave (2) unfolded as a zigzag. Wave A ended at 2520.02, wave B ended at 2641.39, and wave C of (2) ended at 2447.49.
Index then resumed higher in wave (3) towards 2879.22. Internal subdivision of wave (3) unfolded as an impulse in lesser degree. Up from wave (2) low, wave 1 ended at 2538.18, wave 2 ended at 2459.96, wave 3 ended at 2756.89, wave 4 ended at 2657.67, and wave 5 of (3) ended at 2879.22. Index then pullback in wave (4) which ended at 2727.1.
Wave (5) is in progress as a 5 waves where wave 1 ended at 2844.90, wave 2 ended at 2791.76, and wave 3 ended at 2887.72. While dips stay above 2731.44, expect Index to resume higher in wave 5 towards 2914.39 – 2972.73. Index should also complete wave (5) of ((1)) in larger degree and end cycle from March 23 low. Afterwards, it should pullback in wave ((2)) to correct cycle from March 23 low in 3, 7, or 11 swing before the rally resumes.


