PepsiCo (NASDAQ: PEP) is an American multinational food, snack, and beverage corporation offering food (brands include Frito-Lay and Quaker) and drinks, including Pepsi, Tropicana, and Gatorade.
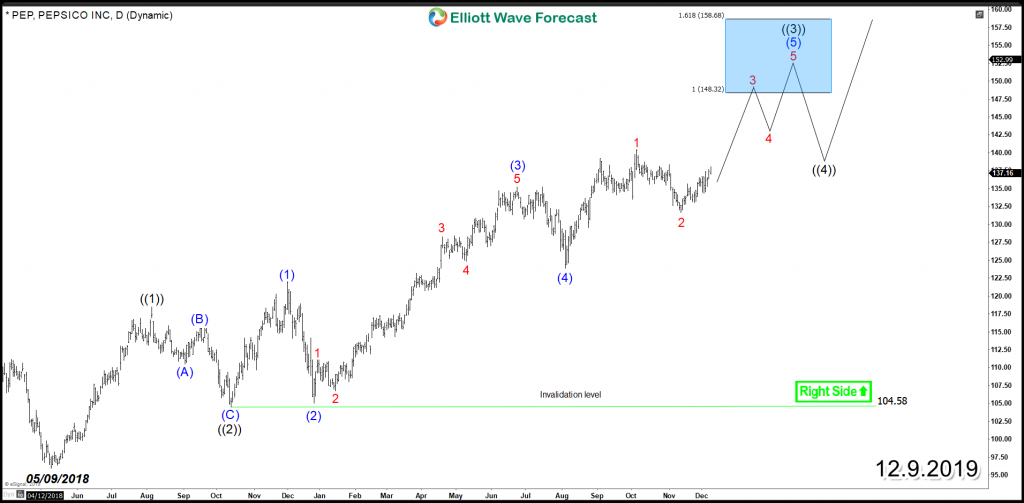
PEP rally since May 2018 is unfolding as an impulsive Elliott Wave structure which currently can still see further upside within an extended wave (5) of of wave ((3)) and reach equal legs area $148.32 -$158.68 before a 3 waves pullback take place in wave ((4)) to correct the rally from October 2018. Then as long as pivot at $104.5 remains intact, PEP will be able to resume the rally to new all time highs to finish the 5 waves advance.
PEP Daily Chart
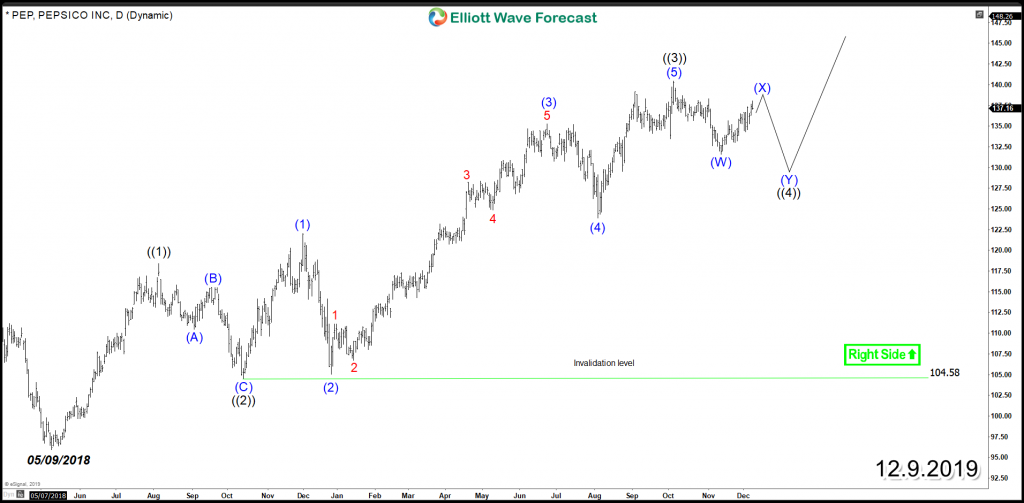
The alternative view would take place if the stock fails to break above October peak from current levels suggesting that wave ((3)) is already in place. Consequently PEP will end up doing a double correction and see further correction lower toward 38.2% Fibonacci retracement level at $126.7 area before ending wave ((4)) then turning higher again for another 5 waves rally.
PEP Alternative Daily Chart
Explore a variety of investing ideas by trying out our services 14 days and learning how to trade our blue boxes using the 3, 7 or 11 swings sequence. You will get access to our 78 instruments updated in 4 different time frames, Live Trading & Analysis Session done by our Expert Analysts every day, 24-hour chat room support and much more.
Back


