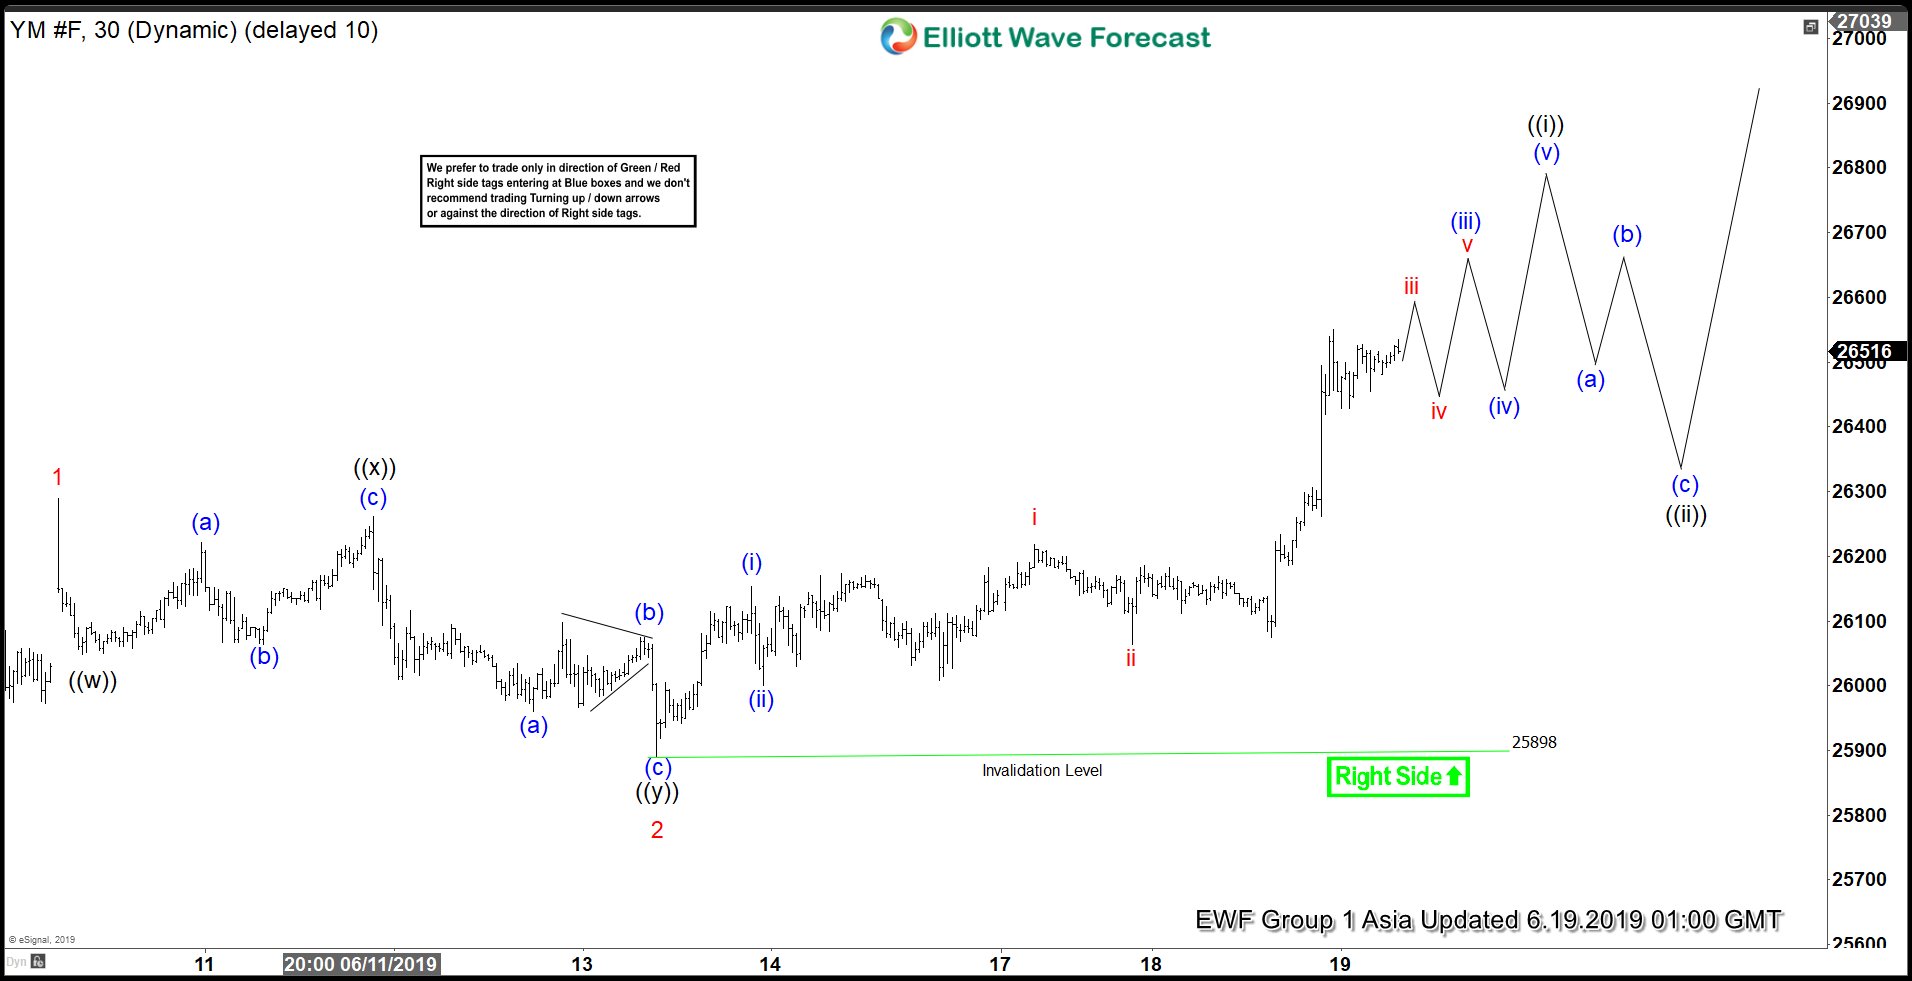
In this article, we will take a look at how we forecast the rally which took place last week in $YM_F. We presented YM_F as Chart Of The Day on 6.19.2019 and explained that break above 6.18.2019 (26289) peak created an incomplete bullish sequence from June 3 low and suggested $YM_F rally has resumed. We were looking for more upside toward 26800 – 26900 area to complete cycle from 6.13.2019 (25891) low before a pull back and higher again. Below, you can see the chart we presented in chart of the day.
$YM_F Elliott Wave Analysis 6.19.2019
Chart below showed YM_F to be still in wave ( iii ) of ( i ) and expected 2 more highs to complete wave ( iii ) before we got a pull back in wave ( iv ) and another high to complete wave (( i )).
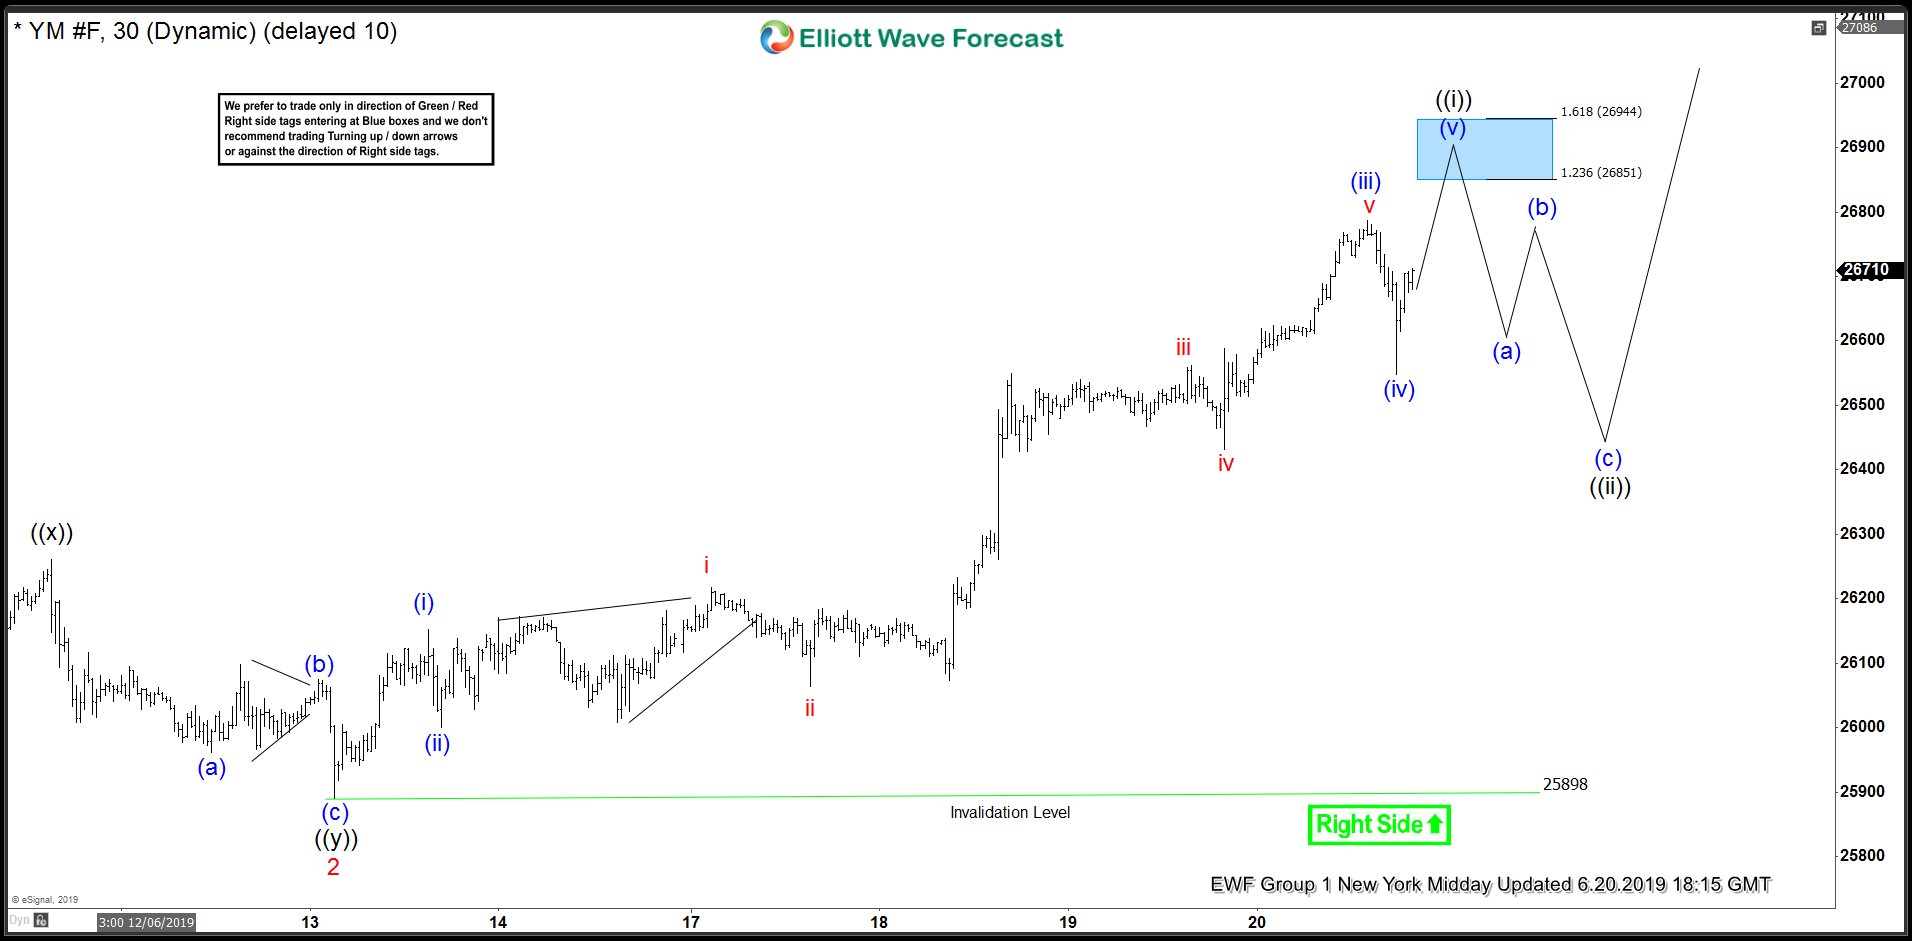
YM_F Short-term Elliott Wave Analysis 6.20.2019
Dow futures did continue higher as expected and finished an extended wave ( iii ) at 26787 on 6.20.2019 before pulling back in wave (iv). In this updated, we called wave ( iv ) completed at 26548 and looked for a new high to complete wave ( v ) of (( i )) and hence complete an Elliott Wave Impulse structure from red wave 2 (6.13.2019) low. Blue box on the chart is the inverse 1.236 Fibonacci extension to inverse 1.618 Fibonacci extension of wave ( iv ) pull back and typical area for wave ( v) to end when wave ( iii ) is extended. We expected wave (( i )) to complete in this area and YM_F to pull back to correct the cycle from red wave 2 (25898) low in wave (( ii )) in 3, 7 or 11 swings and then turn higher again.
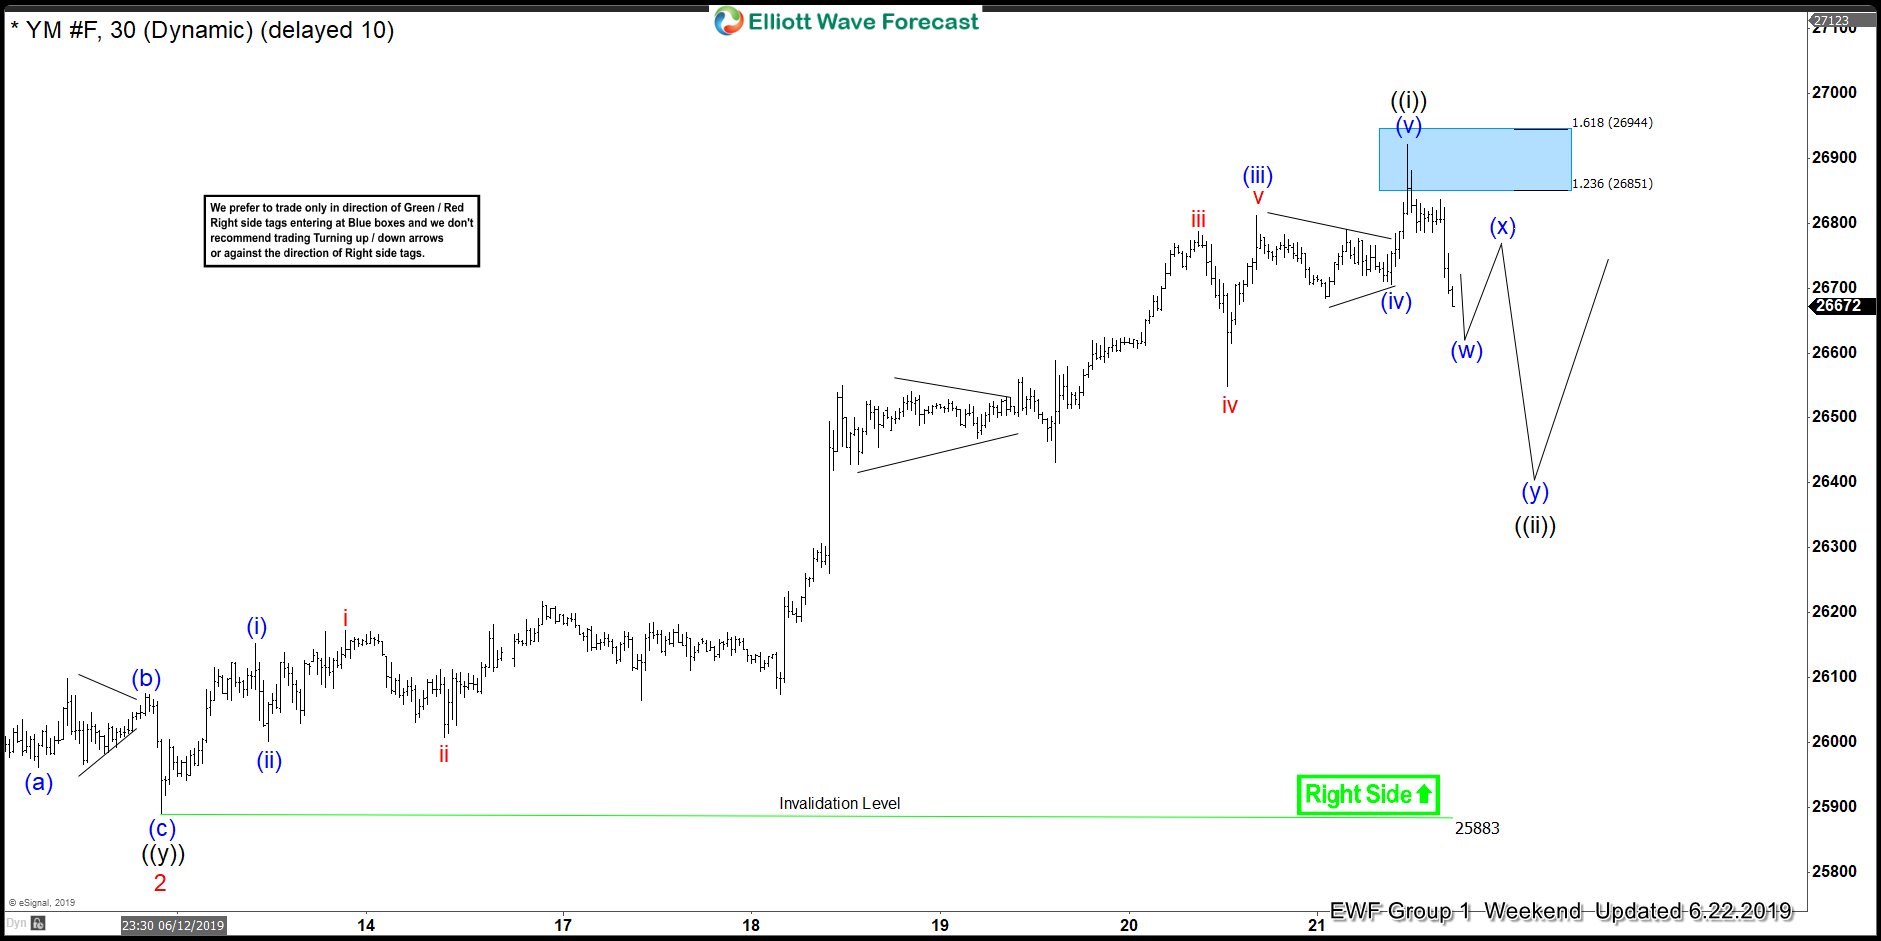
$YM_F Short-term Elliott Wave Analysis 6.22.2019
YM_F (Dow Futures) did make a new high to reach the blue box and started pulling back as expected. Wave (( i )) is proposed completed at 26922 and a pull back in wave (( ii )) is now expected to unfold in 3, 7 or 11 swings and should see buyers as far as price stays above 25898 low (June 13) in the first degree and 25613 (June 3 low) in the second degree. We don’t like selling it.
Back


