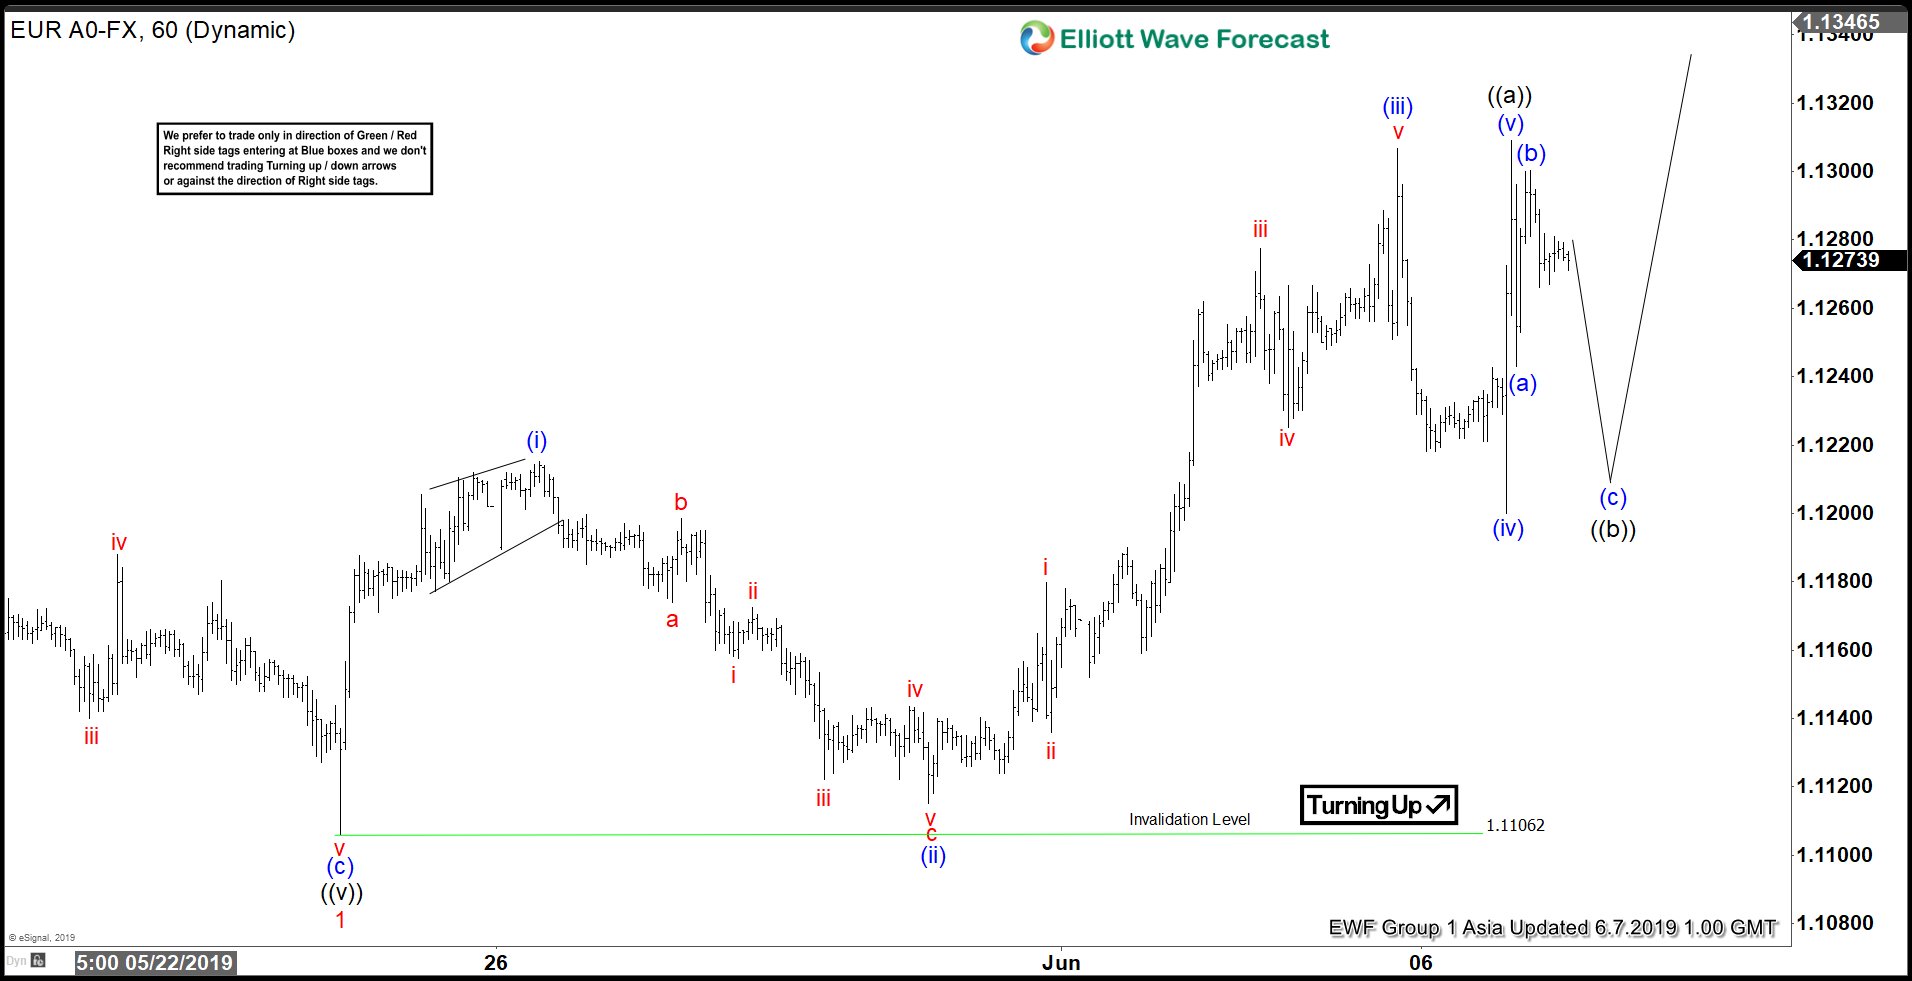
Short term Elliott wave view in EURUSD suggests that the rally from May 23 low (1.11) unfolded as a 5 waves leading diagonal. Up from May 23 low, wave (i) ended at 1.1215 and wave (ii) pullback ended at 1.1115. Pair then resumes higher in wave (iii) to 1.13068, wave (iv) pullback ended at 1.12, and wave (v) of ((i)) ended at 1.1309. As wave (i) and wave (iv) overlaps, this is an example of a 5 waves leading diagonal. The 5 waves diagonal can either end wave ((i)) or wave ((a)). The implication however is the same that further upside is likely.
Short term, pair is correcting the cycle from May 23 low within wave ((ii)) in 3, 7, or 11 swing. Potential target for wave ((ii)) pullback can be measured as 100% Fibonacci extension of (a)-(b) which comes at 1.119 – 1.123 area. Buyers can appear from this area during the dips and pair can extend higher in wave ((iii)) afterwards. Pullback ideally stays above 1.1194 (1.618 fibonacci extension) of wave (a)-(b) or else the decline can become impulsive. We don’t like selling the pair. While pivot at 1.1106 low remains intact in the pullback, expect pair to resume higher again.


