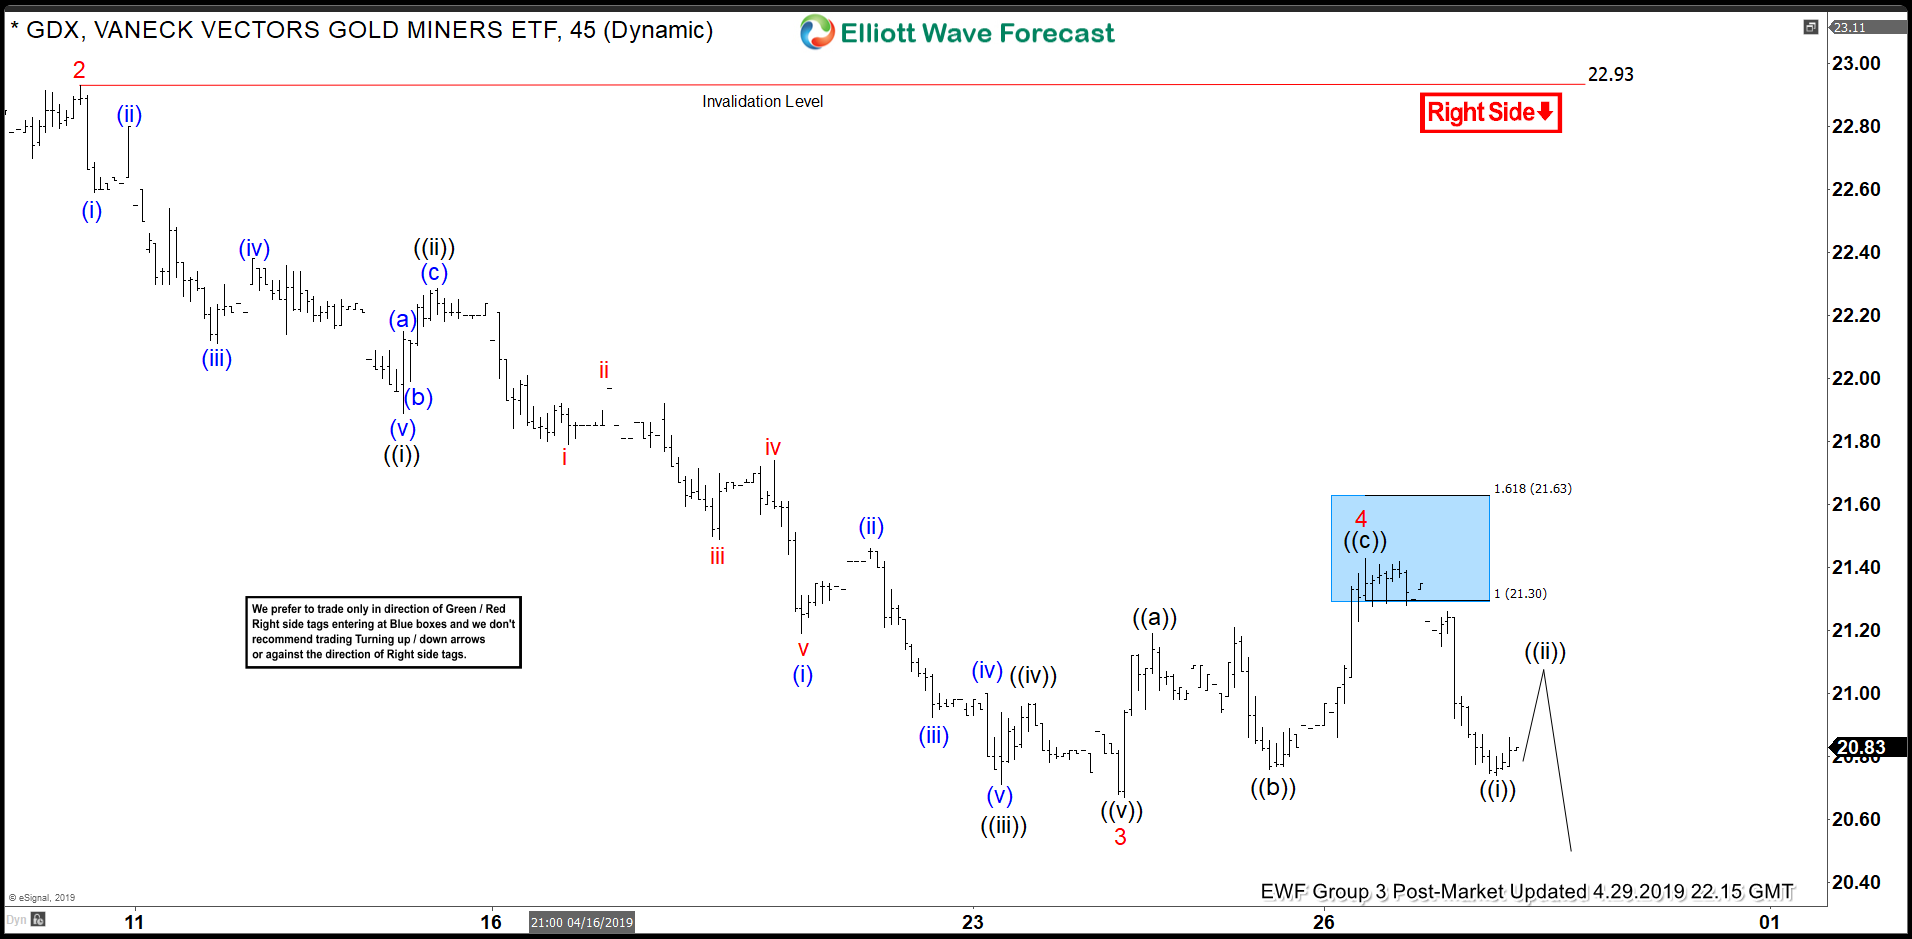
Elliott Wave view calls the decline in Gold Miners ETF (GDX) from March 27, 2019 high ($23.40) as an impulse structure. In the chart below, wave 2 of that impulse ended at $22.93. Down from there, wave 3 ended at $20.67 and wave 4 ended at $21.43. The miners still need to break below wave 3 at $20.67 to validate the view and avoid a double correction. The internal of wave 3 subdivides as an impulse Elliott Wave structure of lesser degree. Wave ((i)) of 3 ended at $21.89 and wave ((ii)) of 3 ended at $22.29. Down from there, wave ((iii)) of 3 ended at $20.71, wave ((iv)) of 3 ended at $20.97, and wave ((v)) of 3 ended at $20.67.
Wave 4 bounce unfolded as a zigzag Elliott Wave structure. Wave ((a)) ended at $21.19, wave ((b)) ended at $20.76, and wave ((c)) of 4 ended at $21.43. Near term, while bounce stays below $21.43, and more importantly below $22.93, expect the miners to extend lower. Potential target to the downside for wave 5 is $19.6 – $20, which is where wave 1 = wave 5.
1 Hour GDX Elliott Wave Chart Post Market Update


