APHRIA is a Canadian cannabis company (TSX:APHA) and in November 2018 it was listed in New York Stock Exchange. The company is as a leader in the production of pharmaceutical-grade cannabis and also produces a range of marijuana and cannabis oil products.
In 2018, Aphria stock took a big hit with a 75% decline as world stock market struggled during the whole year with majority of stocks correcting multi-year cycles. However, with every correction it comes a new investing opportunity and APHA has a clear technical structure providing a clear path.
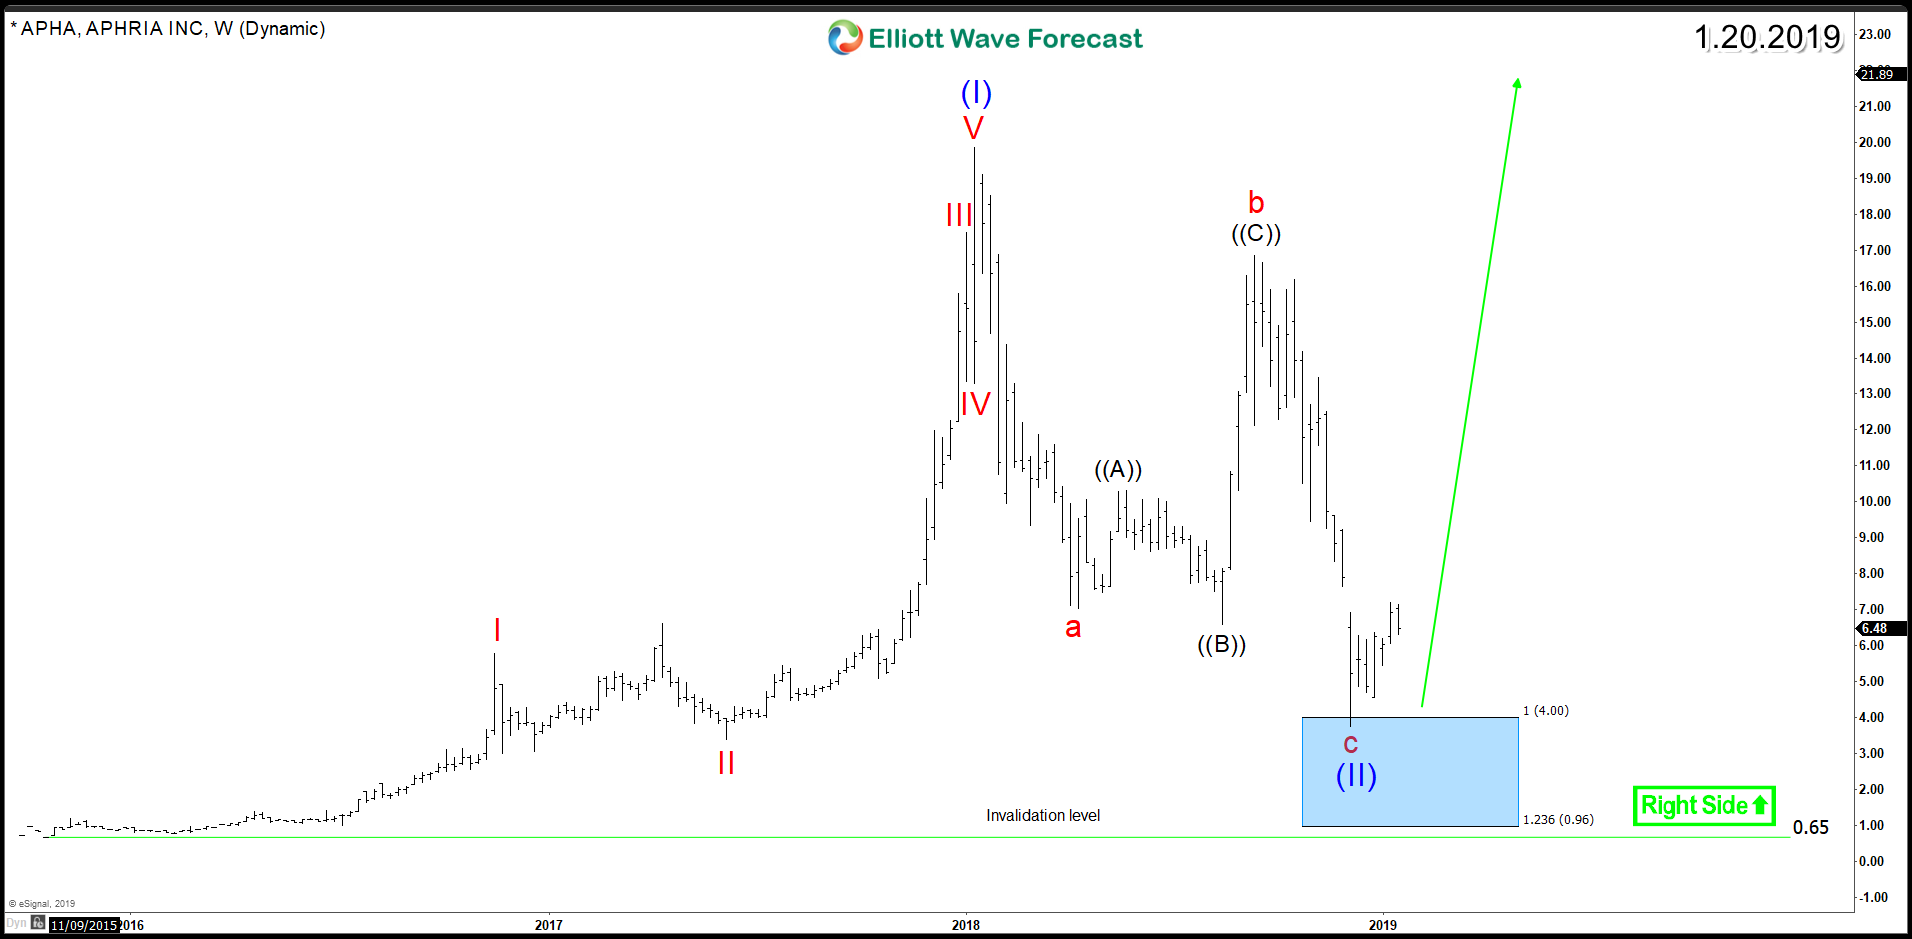
APHA decline from 2018 peak is in 3 waves ( abc ) which represent an Elliott Wave corrective structure called Zigzag. The measured target for wave c is at 100% – 123.6% Fibonacci extension area $4 – $0.96 which the stock already reached. Therefore, a final leg lower may or may not happen at this stage to end the entire correction before the stock either start a new bullish cycle or bounce in 3 waves at least.
Aphria APHA Weekly Chart
The blue boxes in the above chart is a High-frequency area where Market are likely to end cycles and make a turn. Consequently, it can be used to take position in favor of the main trend which is in the case of Aphria to the upside as the previous cycle was an impulsive 5 waves advance. 2019 can be a good year for Marijuana stocks at least for a recovery against 2018 decline.
Get more investing ideas in the Stock Market by trying out our services 14 days and learning how to trade our blue boxes using the 3, 7 or 11 swings sequence. You will get access to our 78 instruments updated in 4 different time frames, Live Trading & Analysis Session done by our Expert Analysts every day, 24-hour chat room support and much more.
Back

