Australian Dollar has seen a surge in volatility at start of the year which started with a sharp decline followed by a quick recovery and AUDCAD is no different. Traders know that volatility brings along trading opportunities so in this video blog, we take a look at the Swing Sequence and Elliott Wave Forecast of AUDCAD forex pair to highlight the next high probability trading area.
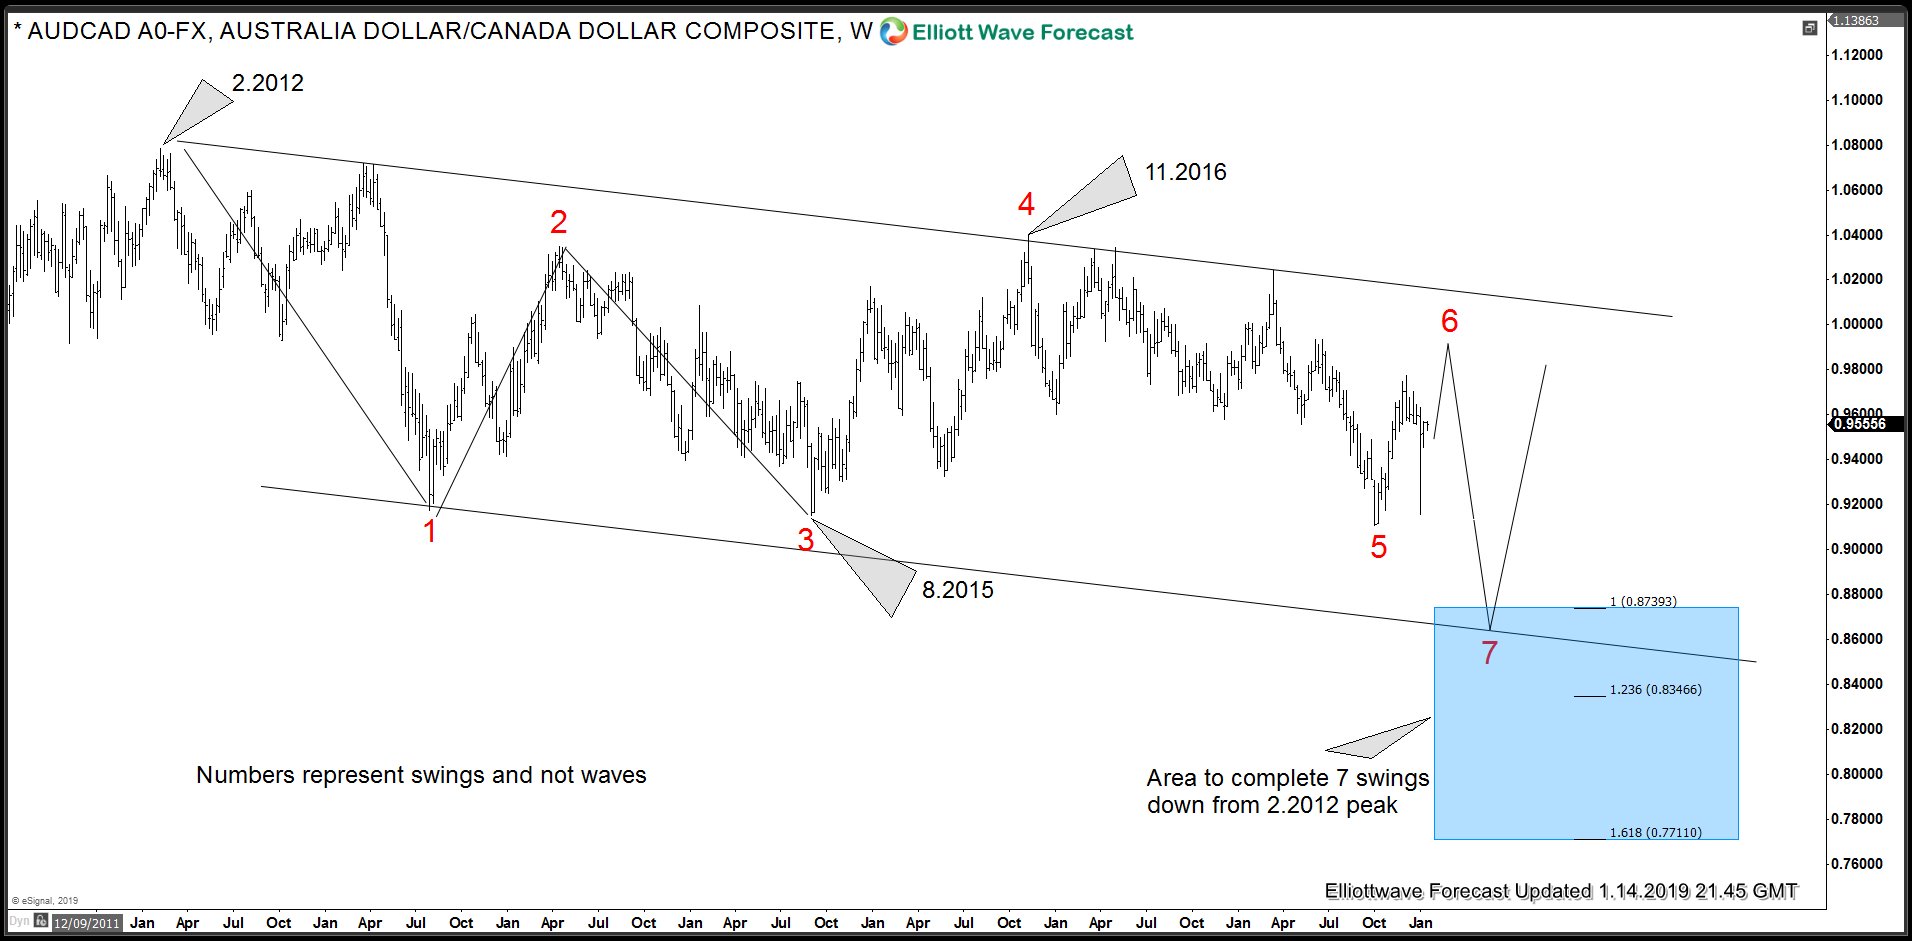
AUDCAD Elliott Wave Swing Sequence from 2012 peak
Chart below shows Elliott wave swing sequence down from 2.2012 peak. Numbers on the chart represent swings and not waves. Currently we can see 5 swings down from 2.2012 peak when 1st swing ended at 0.9175, 2nd swing ended at 1.0349, 3rd swing ended at 0.9151, 4th swing ended at 1.039 and 5th swing ended at 0.9105, 6th swing is proposed to be still in progress and is expected to stay below 4th swing high (1.039) and below the descending trend line (currently at 1.0165) for another swing lower to complete 7 swings Elliott wave sequence between 0.8739 – 0.7711.
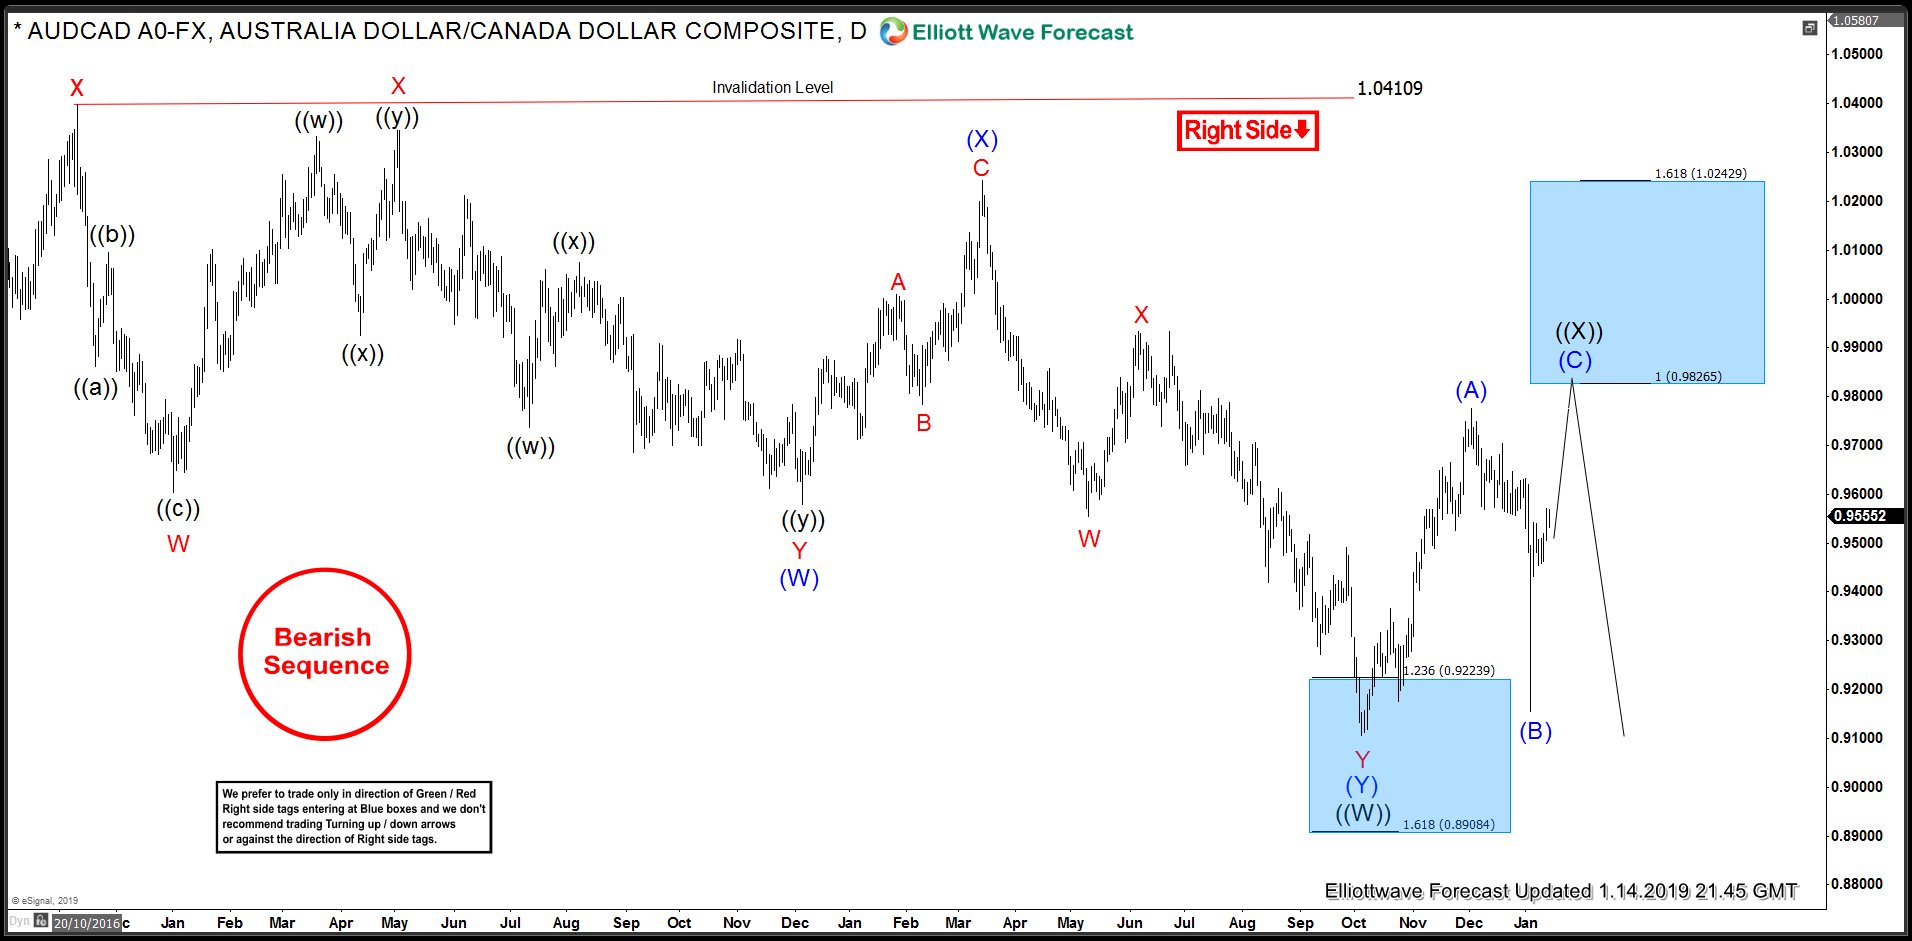
AUDCAD Daily Chart Highlights High Probability Trading Area
AUDCAD daily chart below shows the Elliott Wave structure of the decline from 2016 peak (1.0410). Decline from 1.0410 unfolded in 7 swings and since then pair is proposed to be in a bounce to correct the decline from 1.0410 peak. While above 1/3/2019 (0.9154) low, expect the pair to continue higher toward 0.9826 – 1.0242 area to complete wave ((X)) from where it can resume the decline for new lows toward 0.8739 area or pull back in 3 waves at least to allow sellers to get into a risk free position. As there is no bullish sequence so we don’t like the buying and expect sellers to appear in 0.9826 – 1.0242 area to push prices lower.


