AUDUSD Technical Analysis November 30/2018
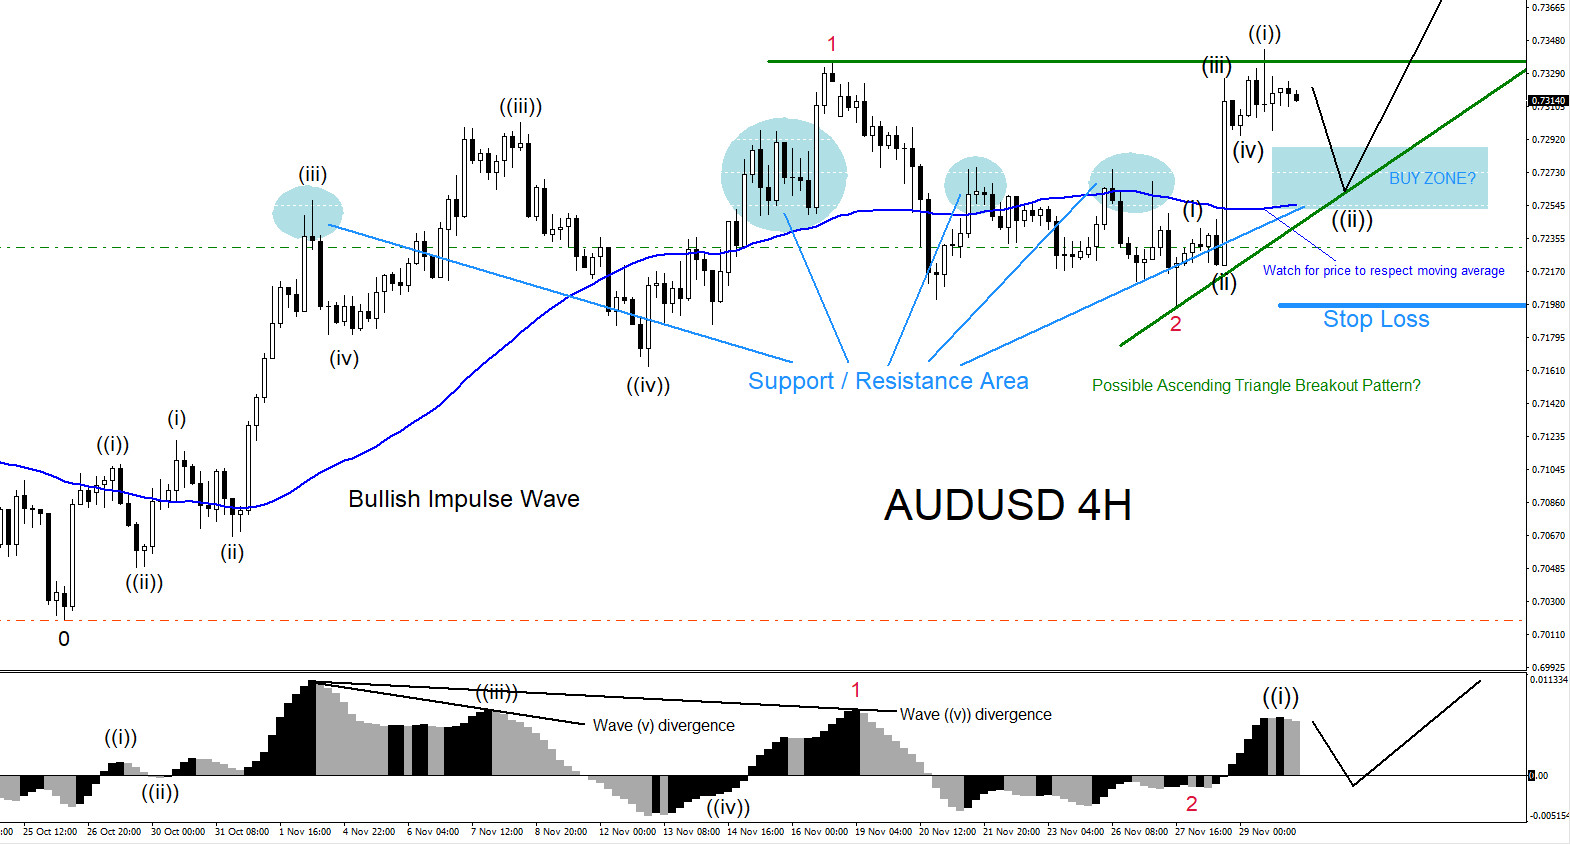
AUDUSD BUY/LONG Trade Setup: October 26/2018 AUDUSD found a bottom and bounced higher. The bounce higher has formed a bullish Elliott Wave Impulse Pattern. The current wave count higher can now be seen as a five wave move with red wave 1 terminating at the high of November 16/2018. The pair corrected lower and terminated wave red 2 at the November 27/2018 low which was then followed by a five wave move higher to terminate wave ((i)) at the November 29/2018 high. If looking to trade AUDUSD, traders will need to watch and wait for a pullback lower towards the blue BUY ZONE and watch for the possible termination of wave ((ii)) in that preferred area. Watch for buying signals and a reversal in the blue box BUY ZONE and expect a rally higher for the strong red wave 3. We remain bullish AUDUSD as long as the red wave 2 low holds and Stop Loss should be placed at this low. We expect the pair to extend higher so traders should look for buying opportunities. Trade safe and always use proper money/risk management on every trade.
AUDUSD 4 Hour Chart 11.30.2018
Of course, like any strategy/technique, there will be times when the strategy/technique fails so proper money/risk management should always be used on every trade. Hope you enjoyed this article and follow me on Twitter for updates and questions> @AidanFX or chat me on Skype > EWF Aidan Chan
*** Always use proper risk/money management according to your account size ***
At Elliottwave-Forecast we cover 76 instruments (Forex, Commodities, Indices, Stocks and ETFs) in 4 different timeframes and we offer 5 Live Session Webinars everyday. We do Daily Technical Videos, Elliott Wave Trade Setup Videos and we have a 24 Chat Room. Our clients are always in the loop for the next market move.
Try Elliottwave-Forecast for 14 days FREE !!! Just click here –> 14 day FREE trial
Back


