Johnson & Johnson (NYSE: JNJ) is one of the oldest companies around the market as it was founded in 1886. It manufactures medical devices, pharmaceutical and consumer packaged goods and its stock JNJ represent 10.8% of the Health Care ETF “XLV” weight.
J&J beats Earnings & Sales Estimates in Q3 and since the release in mid October the stock has been rallying higher looking to challenge 2018 peak. So let’s take a look at the technical picture of the stock using Elliott Wave Theory.
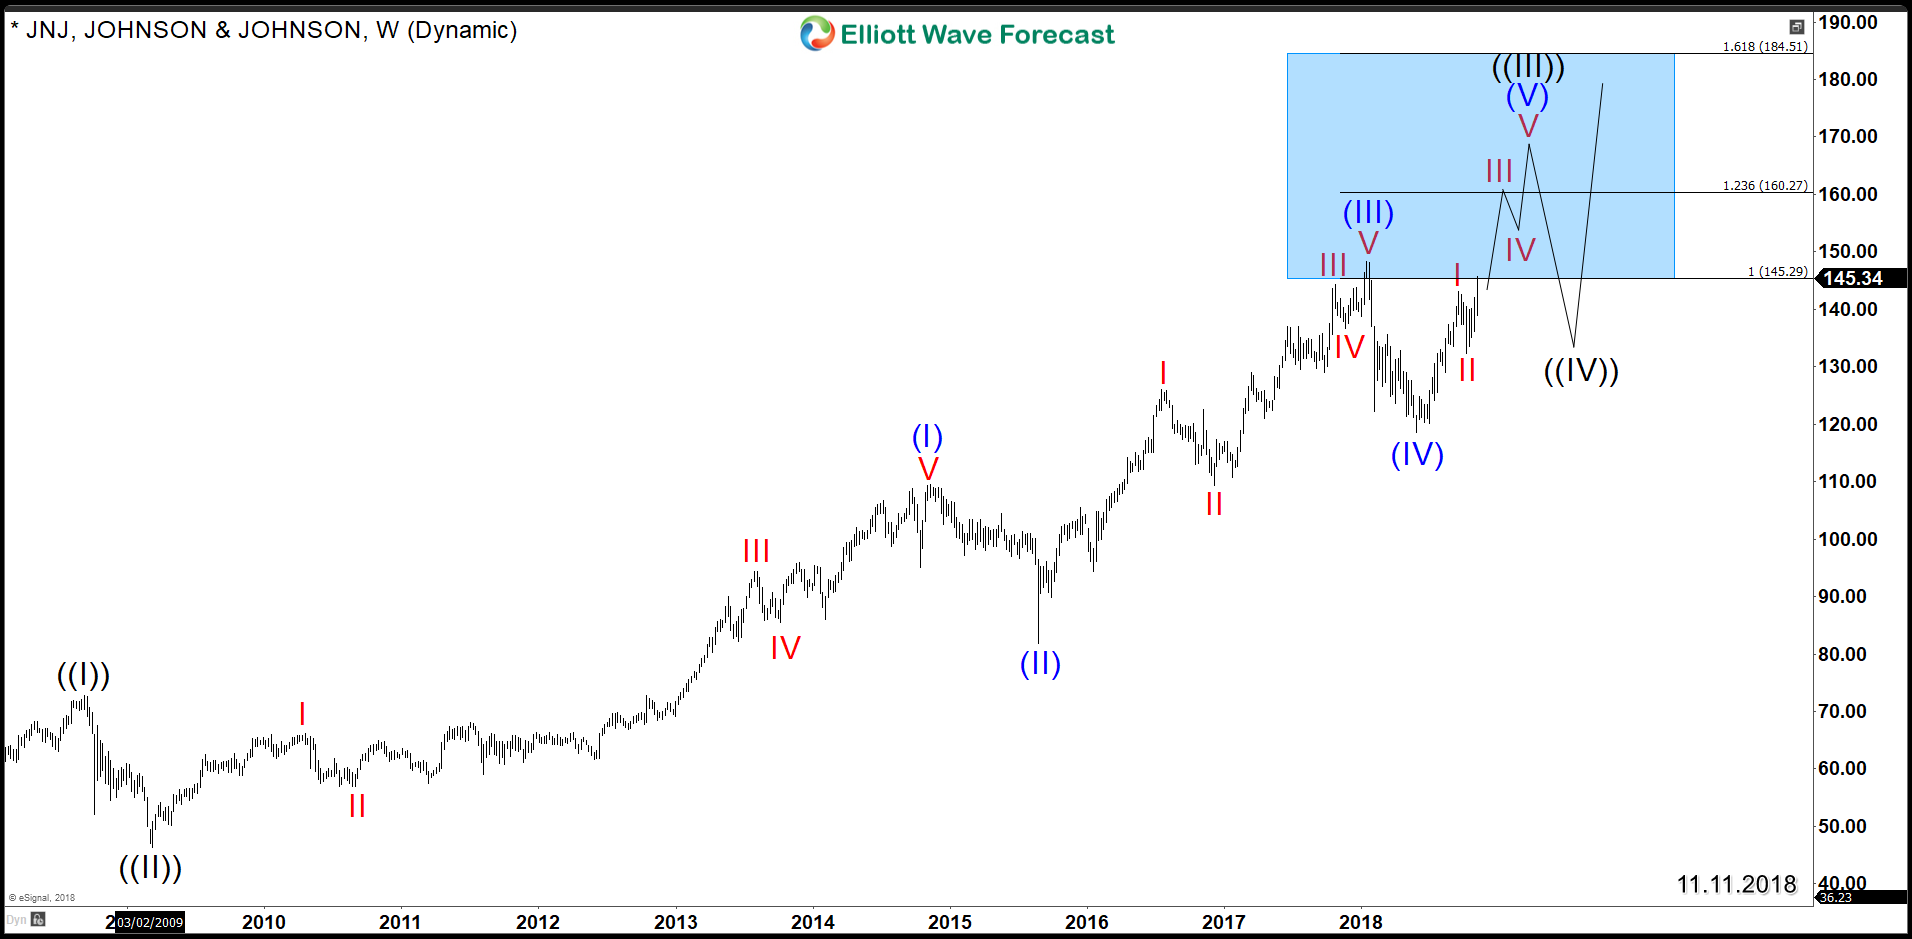
JNJ Weekly Elliott Wave Chart
As we can see in the above weekly chart, JNJ is advancing in an impulsive structure since 2009 low. The stock is still looking to extend further higher before ending the 5th wave of the Grand Super Cycle wave ((III)) after taking 2018 peak. Consequently, the healthy uptrend is still in progress and investors shouldn’t be worried about it yet.
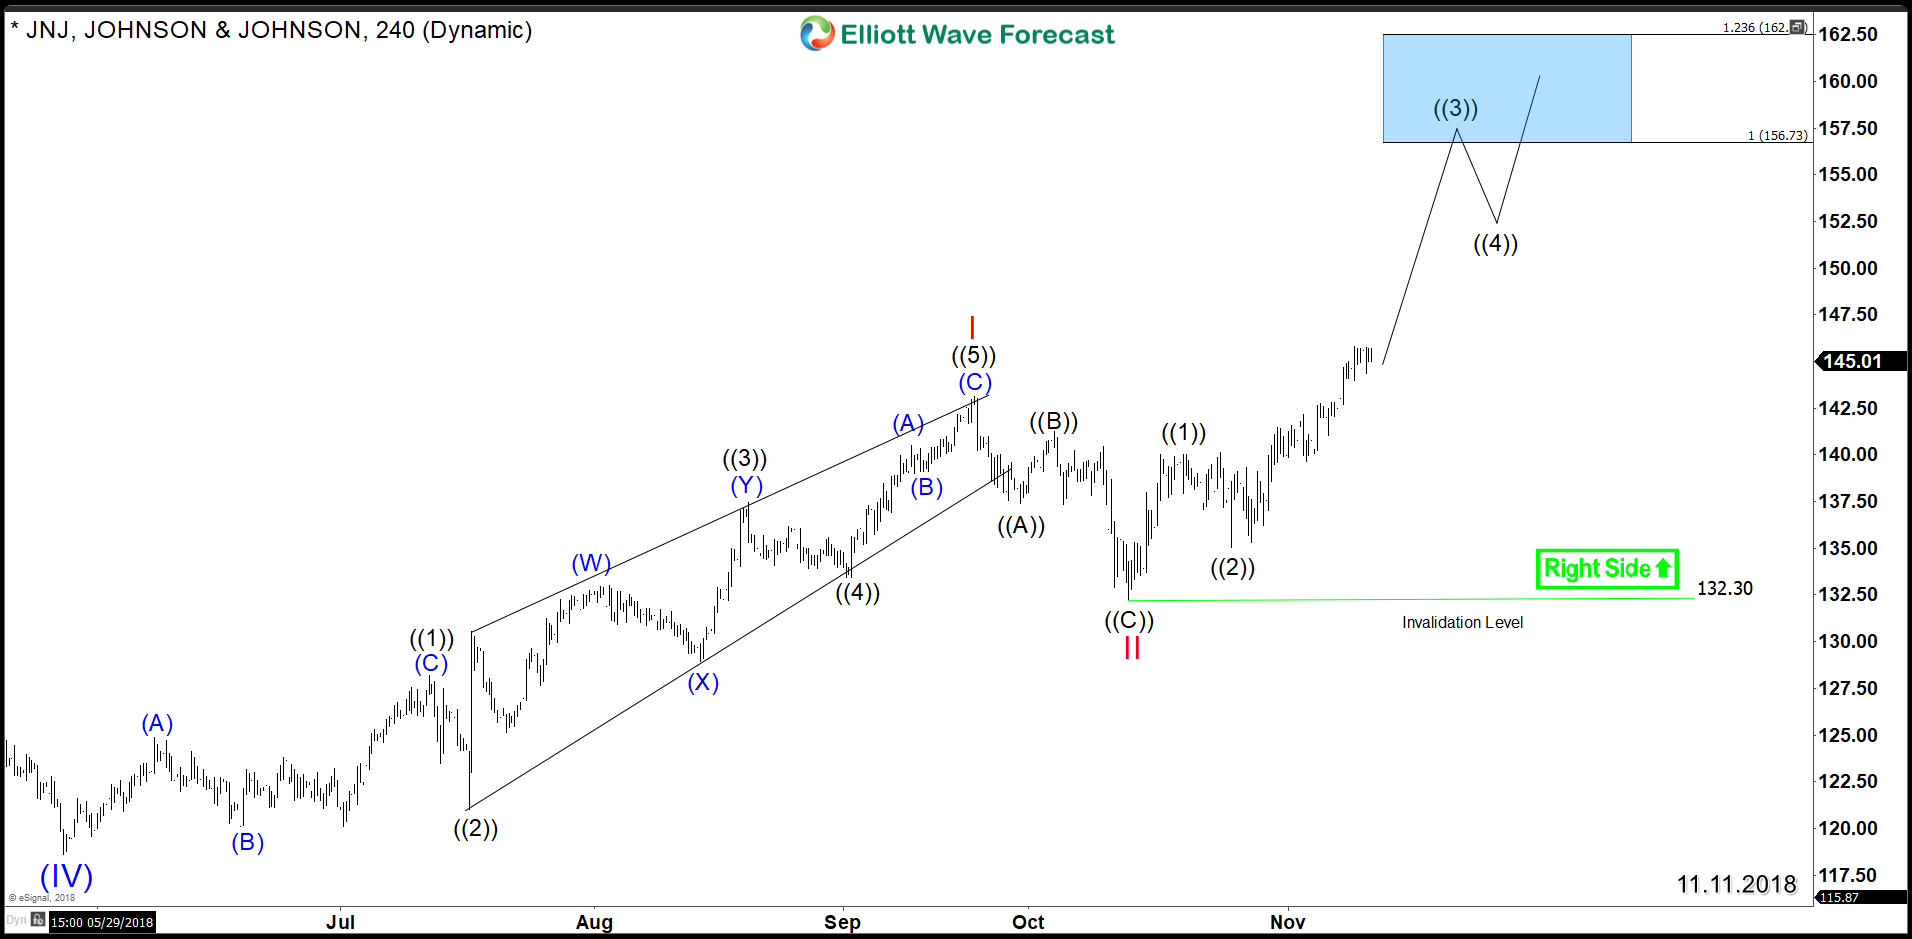
JNJ 4H Elliott Wave Chart
Switching to the recent 4 Hour chart, the stock managed to take September peak during the recent week rally. This move opened a new bullish impulsive sequence to the upside as it will be looking for a minimum target around the equal legs blue box area $156- $162. Therefore, as long as October low $132 remains intact then the stock will find buyers in 3, 7 or 11 swings short term pullback and will be able to make new all time highs.
In conclusion, the drug and consumer products giant has a clear bullish path in both short & long term which can last for few years, allowing investors and traders to take part of this impulsive trend.
Get more insights about the Health Care Sector and it’s related stocks by trying out our services 14 days to learn how to trade our blue boxes using the 3, 7 or 11 swings sequence. You will get access to our 78 instruments updated in 4 different time frames, Live Trading & Analysis Session done by our Expert Analysts every day, 24-hour chat room support and much more.
Back


