NZD JPY has been rallying this week but the question remains if the down move is over and uptrend has resumed or this is just a corrective bounce within an incomplete downward Elliott wave swings sequence. We will take a look at the daily chart of NZD JPY to get an answer to this question and see if bulls are in control or if the current bounce is an opportunity for sellers. We will also take a look at 1 Hour chart of the pair to study the short-term Elliott wave structure in detail.
NZD JPY Daily Elliott Wave Analysis
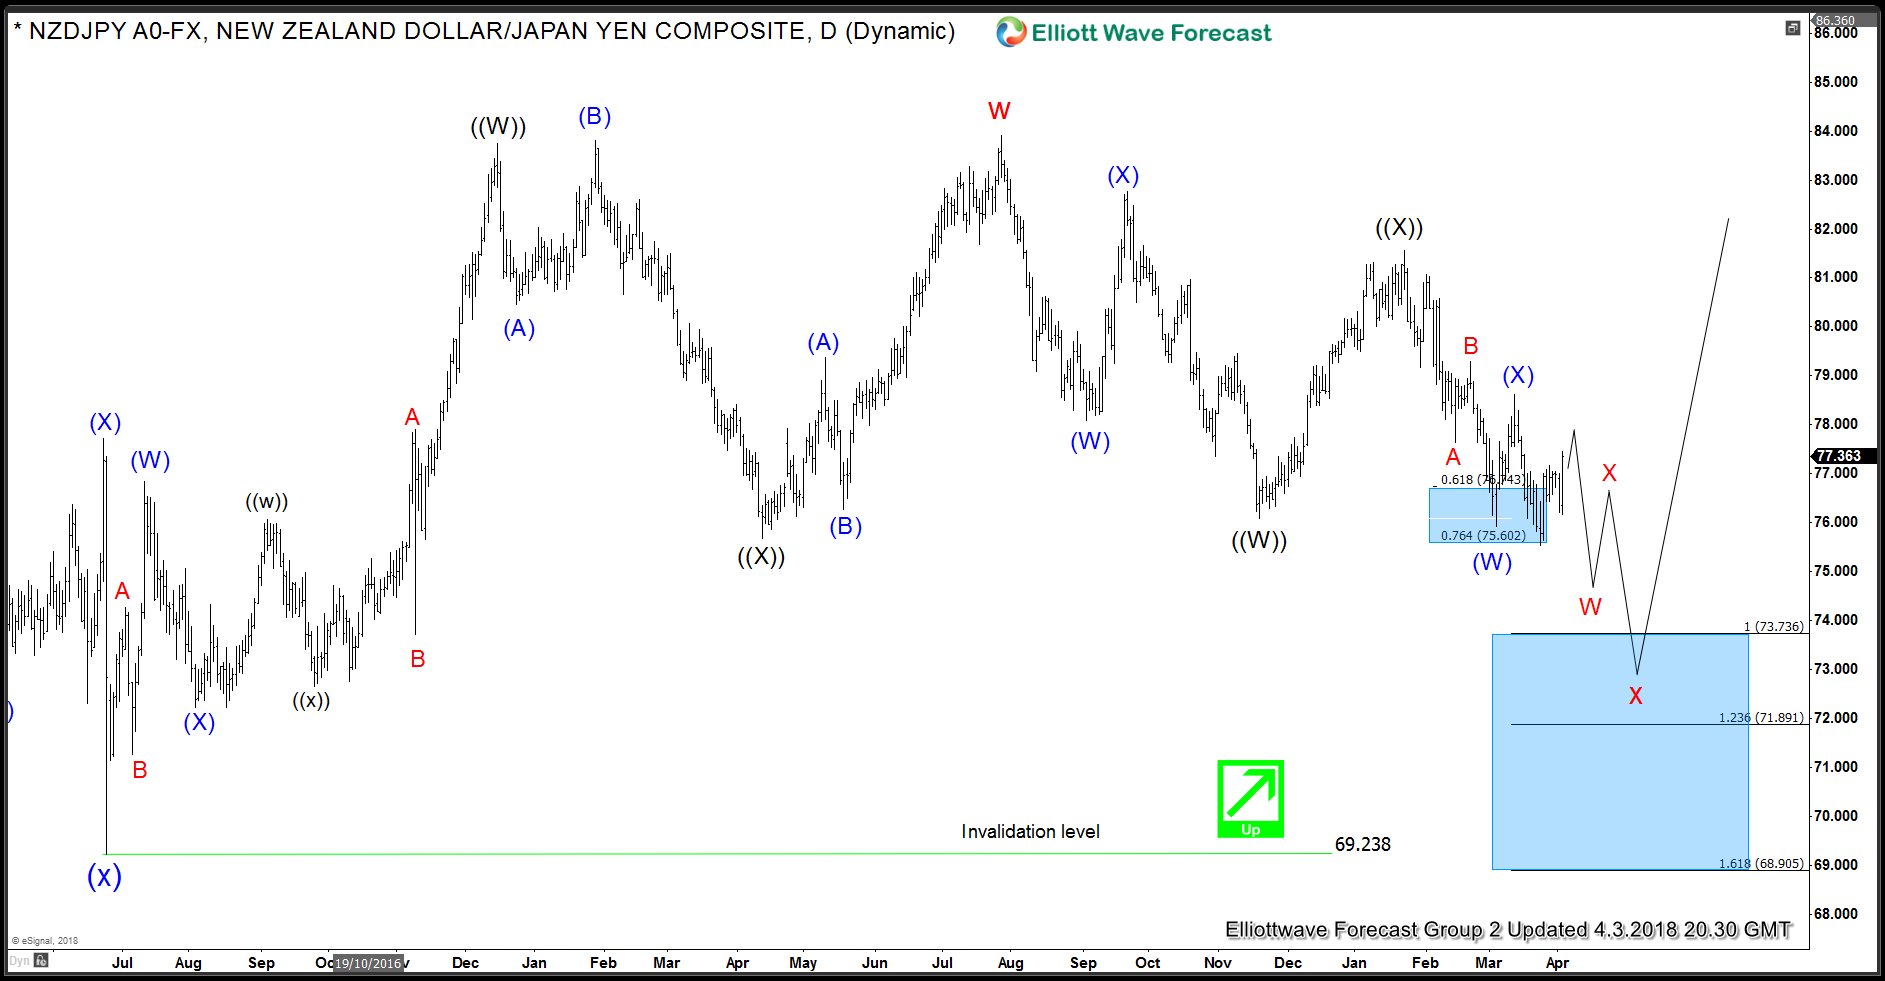
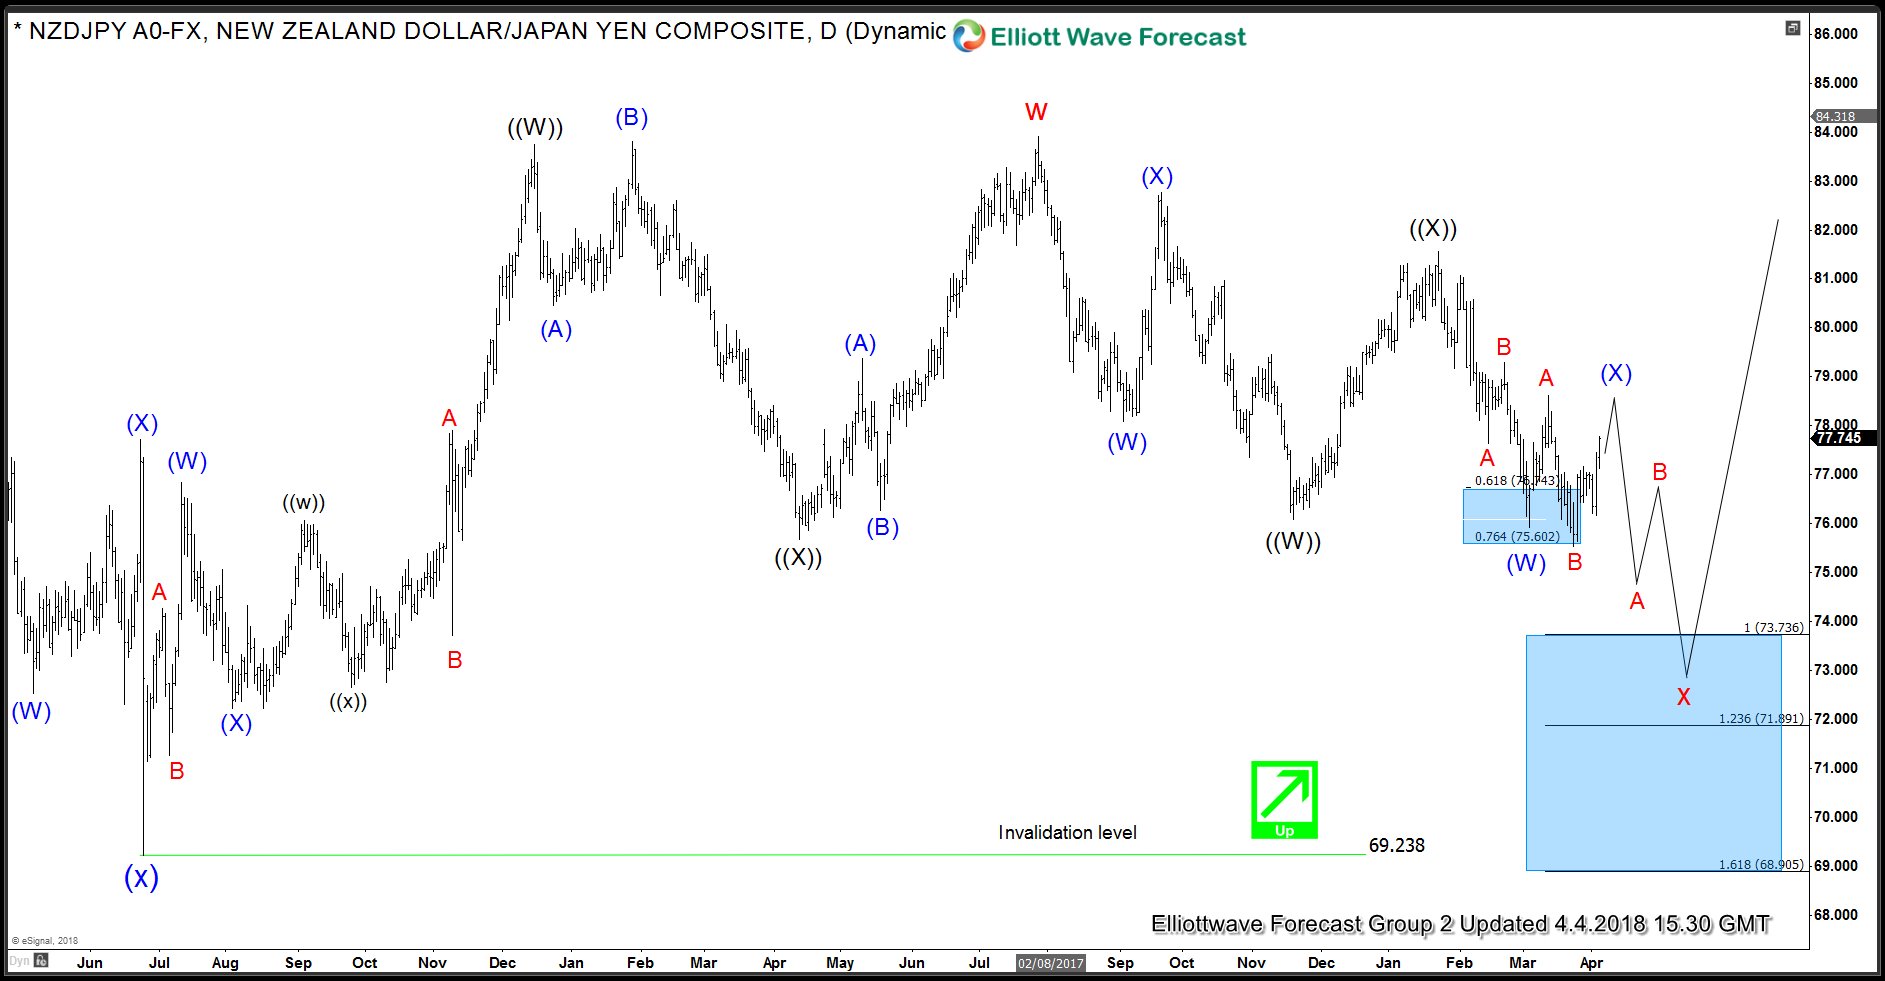
Daily Elliott Wave Analysis of the pair suggests rally from 6.24.2016 (69.23) low unfolded as a double three structure within which wave ((W)) completed at 83.73 while wave ((X)) ended at 75.67 as a FLAT structure. Rally to 83.91 completed wave ((Y)) and also completed cycle degree wave “w” on 7.27.2017. Then the pair started a pull back to correct the cycle from blue (x) low at 69.21. This pull back is also taking the form of a double three Elliott wave structure when wave ((W)) ended at 76.09, wave ((X)) ended at 81.56 and wave ((Y)) lower is now in progress and should ideally reach 73.736 – 71.891 area to complete cycle degree wave “x” pull back. Down from ((X)) peak at 81.56, we can see that pair is showing 5 swings lower which means the sequence is incomplete and the current bounce should fail below blue (X) peak at 78.62 for extension lower towards 73.736 – 71.891 area which is shown with a shaded blue box on the chart. If pivot at 78.62 high gives up, that would suggest wave (X) could take the form of a FLAT before pair turns lower again. In this case, pair could see 78.33 – 80.05 area before turning lower again because the sequence from 83.91 (7.272017) high would still be incomplete.
Now, let’s take a look at 1 Hour chart to study the short-term Elliott wave structure in the pair.
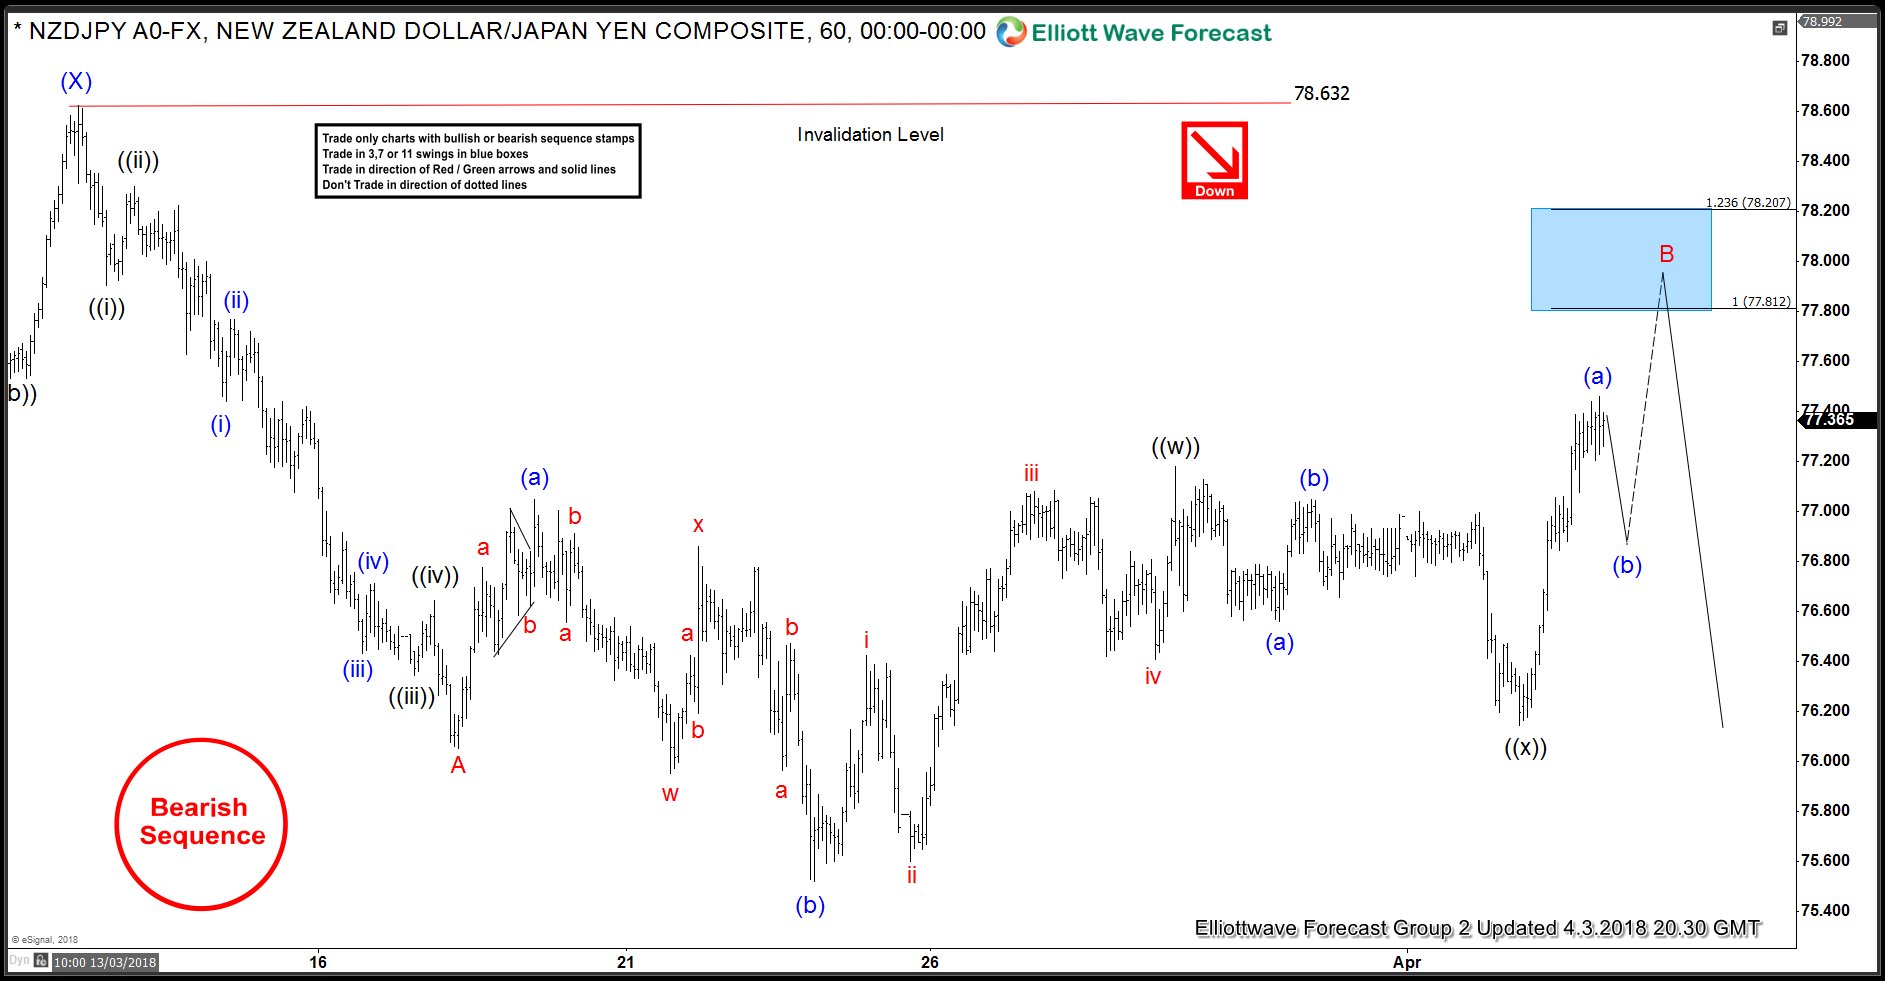
NZDJPY 1 Hour Elliott Wave Analysis 4.3.2018
Chart above shows that decline from 78.63 to 76.05 was a 5 waves move and completed wave A. This was followed by a 3 waves bounce to 77.04 and then a new low to 75.52. The new low, however, was in 3 waves due to which we believe the 5 waves rally from 75.52 to 77.18 was part of a FLAT correction from 76.05 low. Sellers then pushed prices lower and attempted to start wave C lower but selling was not strong enough and pair has now broken above 77.18 high which means that FLAT Elliott Wave structure to 77.18 completed only wave ((w)) of B while dip to 76.14 was wave ((x)). As dips hold above this level, pair has scope to make 1 more push higher towards 77.81 – 78.20 area to complete 7 swings in wave B. This is the next inflection area in the pair highlighted with a blue box as from there pair would either resume the decline in wave C as far as prices stay below 78.63 or make a 3 waves pull back at least to correct the cycle from ((x)) low at 76.14 and turn higher again to become a FLAT in wave (X).
Back


