Hello fellow traders. In this technical blog we’re going to take a quick look at the past Elliott Wave charts of CADJPY published in members area of the website. In further text we’re going to explain the short term Elliott Wave view. As our members know, we have been syaing saying that the pair has reached the extreme area from the 09/15 2017 peak. However due to incomplete swings sequences we have had in USDJPY and NZDJPY, we knew that CADJPY decline should extend further.
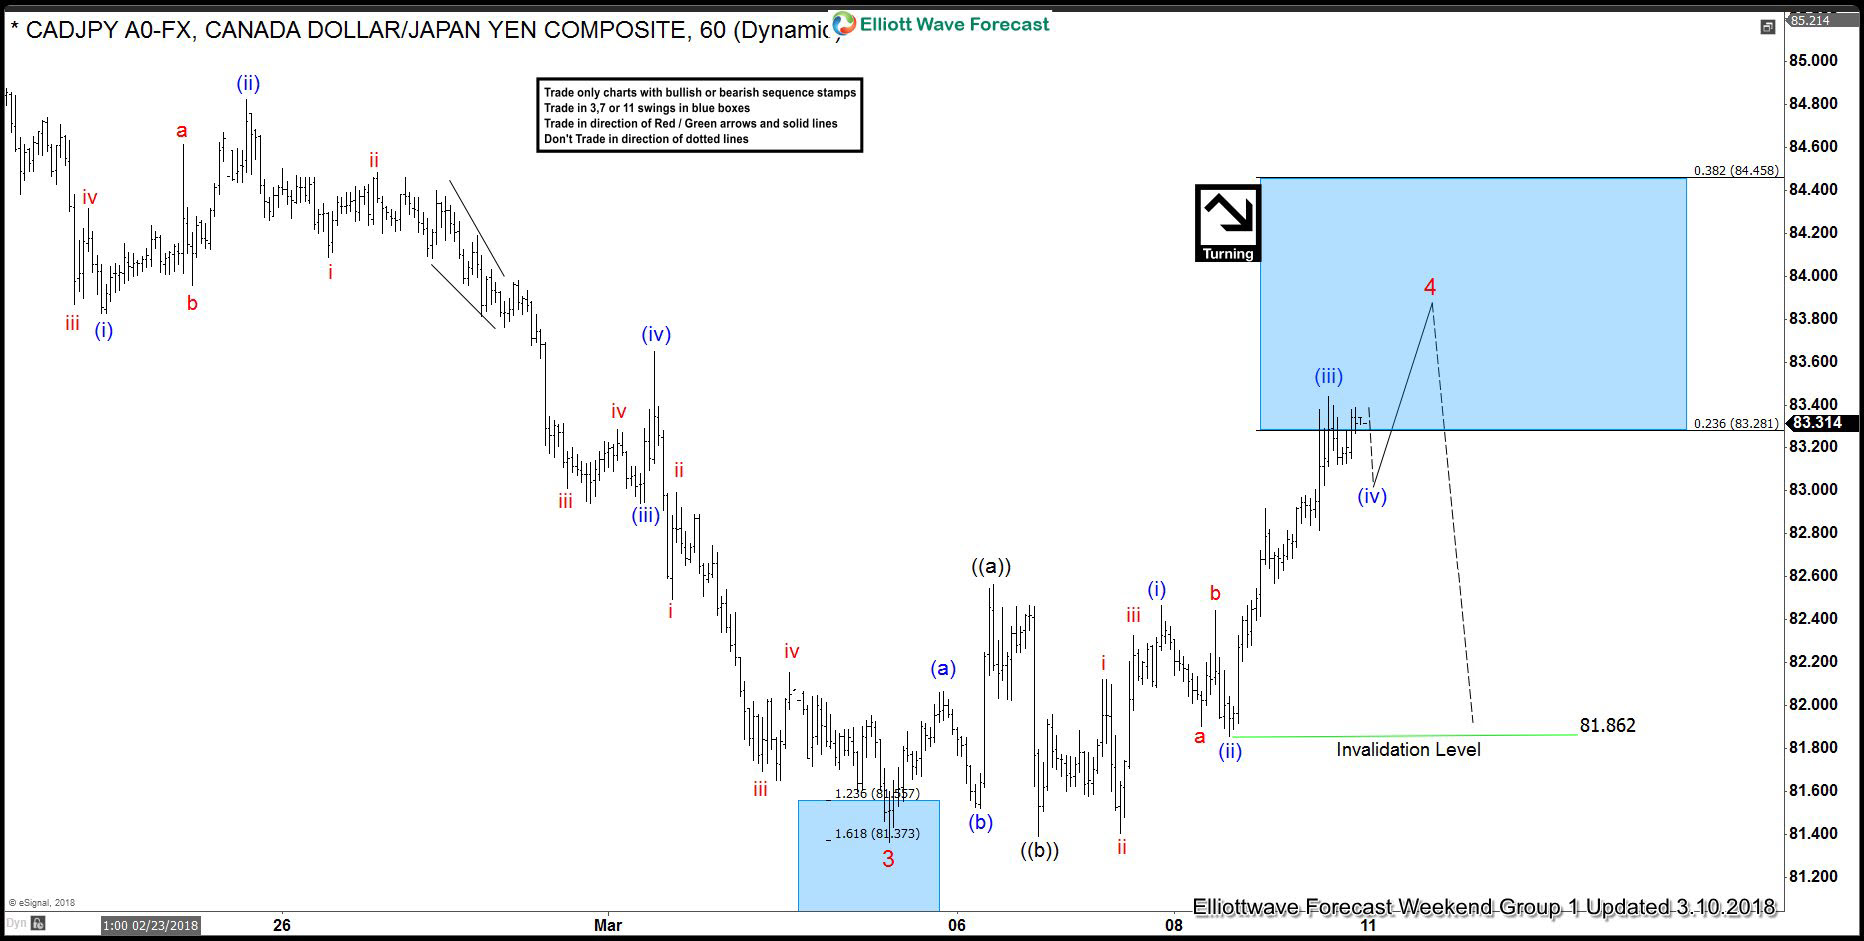
CADJPY Elliott Wave 1 Hour Chart 3.10.2018
Cycle from the September 2017 peak is still in progress as Elliott Wave Flat structure. We’re doing wave 4 of (C) of FLAT. Correction is already at the extremes from the wave 3 red low ( 03/05) and we believe wave 4 red of (C) is also unfolding as a FLAT. The pair has reached 23.6-38.2 Fibonacci retracement zone at 83.28-84.45. We expect wave 4 red to complete there, however another marginal push up would be ideal. That way the price structure will have 5 waves in wave ((c)) of 4. Although the pair should resume decline ideally , selling the pair is tricky as the pair has already reached extremes from the September peak. We call it lower due to correlation with other JPY pairs like USDJPY and NZDJPY, that still showing incomplete structures.
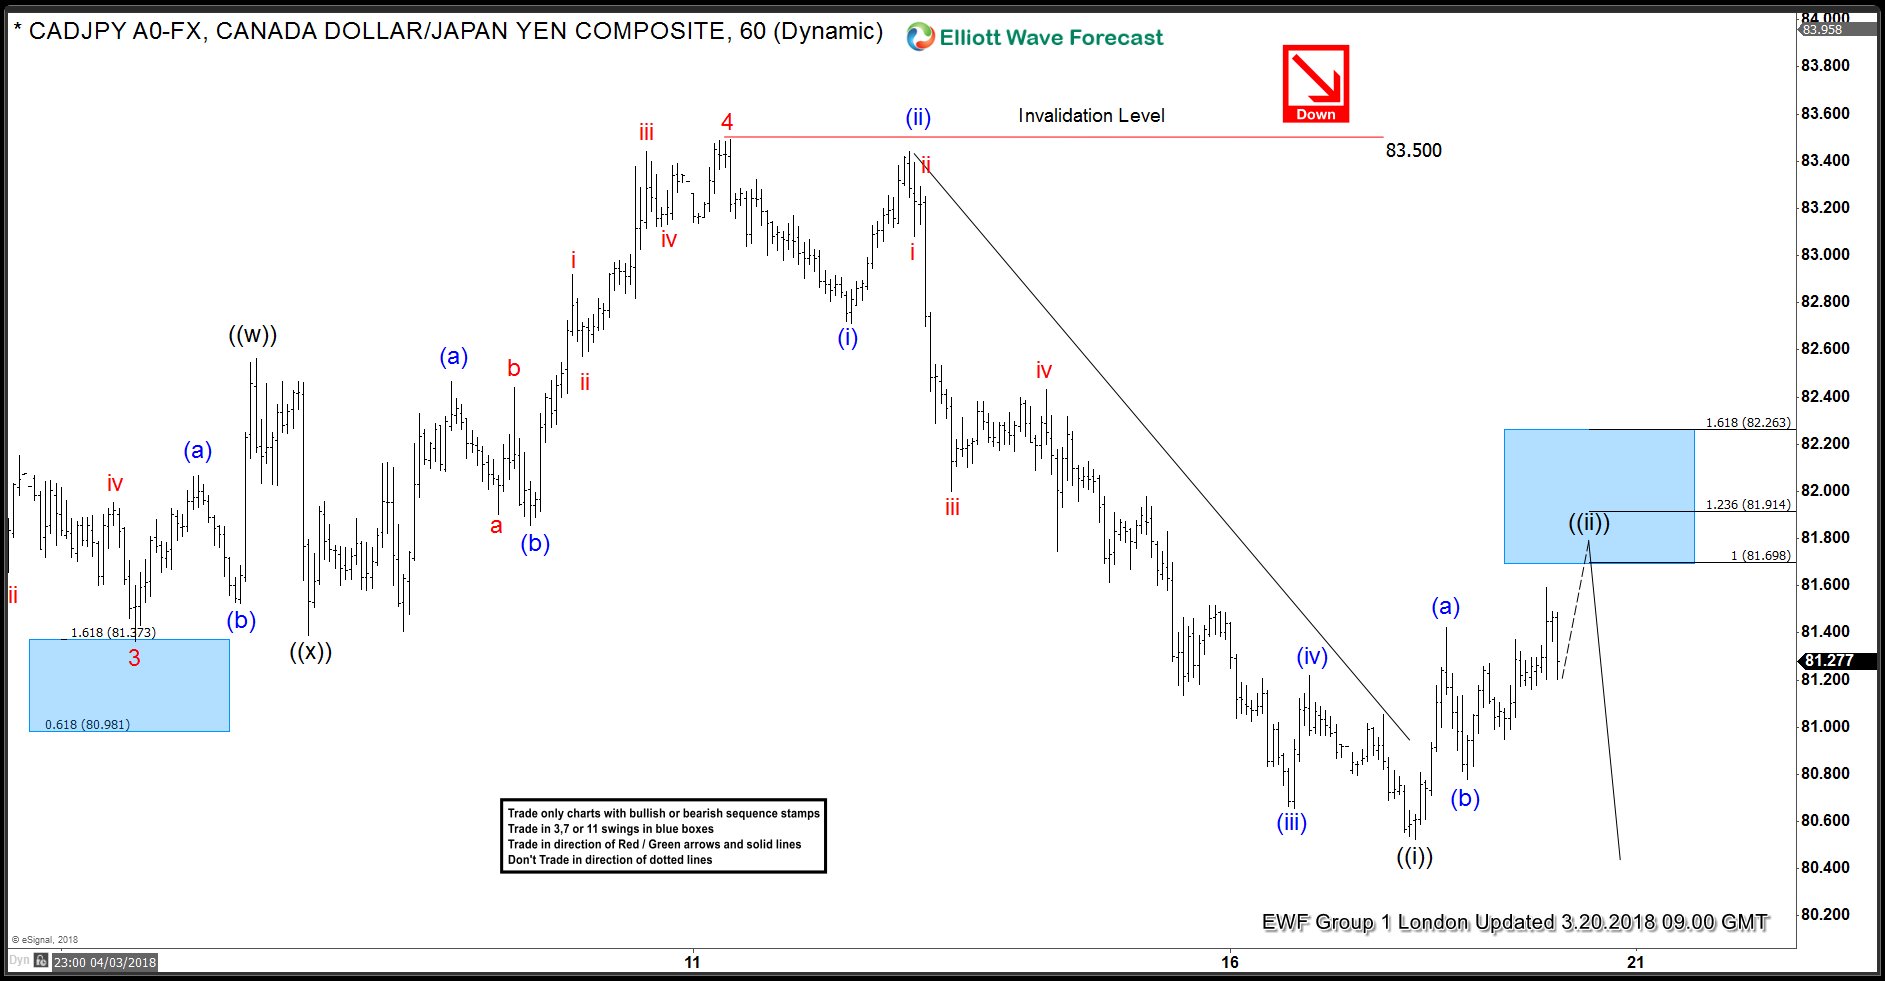
CADJPY Elliott Wave 1 Hour Chart 3.20.2018
The pair has found sellers at proposed area 83.28-84.45 and found sellers there. The pair completed wave 4 red recovery at the 83.5 peak and gave us expected decline. As a result the price has made new low , duggesting another extension to the downside. Keep in mind the pair is at the extreme from the September 2017 peak and this chart is not trading recommendation. Best instruments to trade are those having incomplete bullish or bearish swings sequences. They are shown in Sequence Report and best among them are presented in the Live Trading Room.
Elliott Wave Forecast
We cover 78 instruments in total and present Official Trading Recommendations in Live Trading Room. If not a member yet, Sign Up for 14 days Trial now and get access to new trading opportunities.
Through time we have developed a very respectable trading strategy which defines Entry, Stop Loss and Take Profit levels with high accuracy and allows you to make position Risk Free, shortly after taking it. If you want to learn all about it and become a professional Trader. Our technical analysts stand ready 24 hours from Monday – Friday to provide the latest market update and answer your market question.
Trade Safe & Good Luck!
Back


