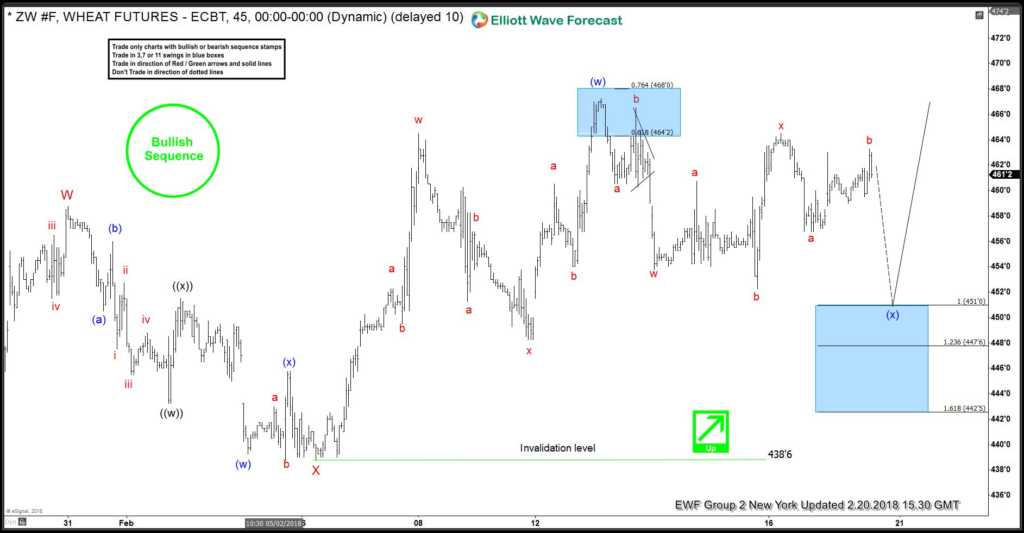
On Feb 20, Wheat (ZW_F) daily chart shows incomplete bullish sequence from 8.29.2017 low, favoring further upside towards 472.7 – 489. In the Live Trading Room, we informed members we like to buy wave (x) dips at 451.3 inside the blue box (see chart above) as far as pivot at 438.6 stays intact. Below is the setup we present in the trading journal:
Wheat (ZW_F) Trade Video Clip from 7 Feb 2018 Elliott wave Live Trading Room
Wheat (ZW_F) 1 Hour Elliott Wave Chart 2.20.2018
We hit the 472.7 target on Feb 27 for $21.4 profit. With 1-2% risk / trade taken and 2.1 Reward vs Risk, members should make 2.1% to 4.2% profit, depending on the risk % taken.
Join us in Live Trading Room everyday to get the best trading idea using our unique trading system of 3-7-11 swing. Live Trading Room Group 1 starts at 6 AM EST / 11 AM GMT. Live Trading Room Group 2 starts at 5 AM EST / 10 AM GMT. You can also take 14 days FREE TRIAL without commitment and check our service completely FREE. In addition to Live Trading Room, you will get access to Elliott wave charts in 4 time frames, live sessions, 24 hour chat room, and much more.
Back


