Back in November 2016, we mentioned that XAUAUD should find buyers in 1540 – 1487 area and bounce ideally to resume the rally for new highs or in 3 waves at least. XAU AUD reached the mentioned area a few weeks later in December 2016, found a low at 1525 on 12/15/2016 and started rallying. Rally got rejected at 61.8 Fibonacci retracement (1728) of the drop from June 2016 peak but was enough to let the long positions from 1540 (100% extension) to get Risk Free. We did an update on XAUAUD in June 2017 in which we said cycle from December 2016 low had ended but we expected pull backs to hold above December 2016 low for continuation higher.
Pull back which extended into July 2017 did hold above December 2016 low as expected and XAU AUD has started rallying again. Let’s take a look at the update chart in the daily time frame.
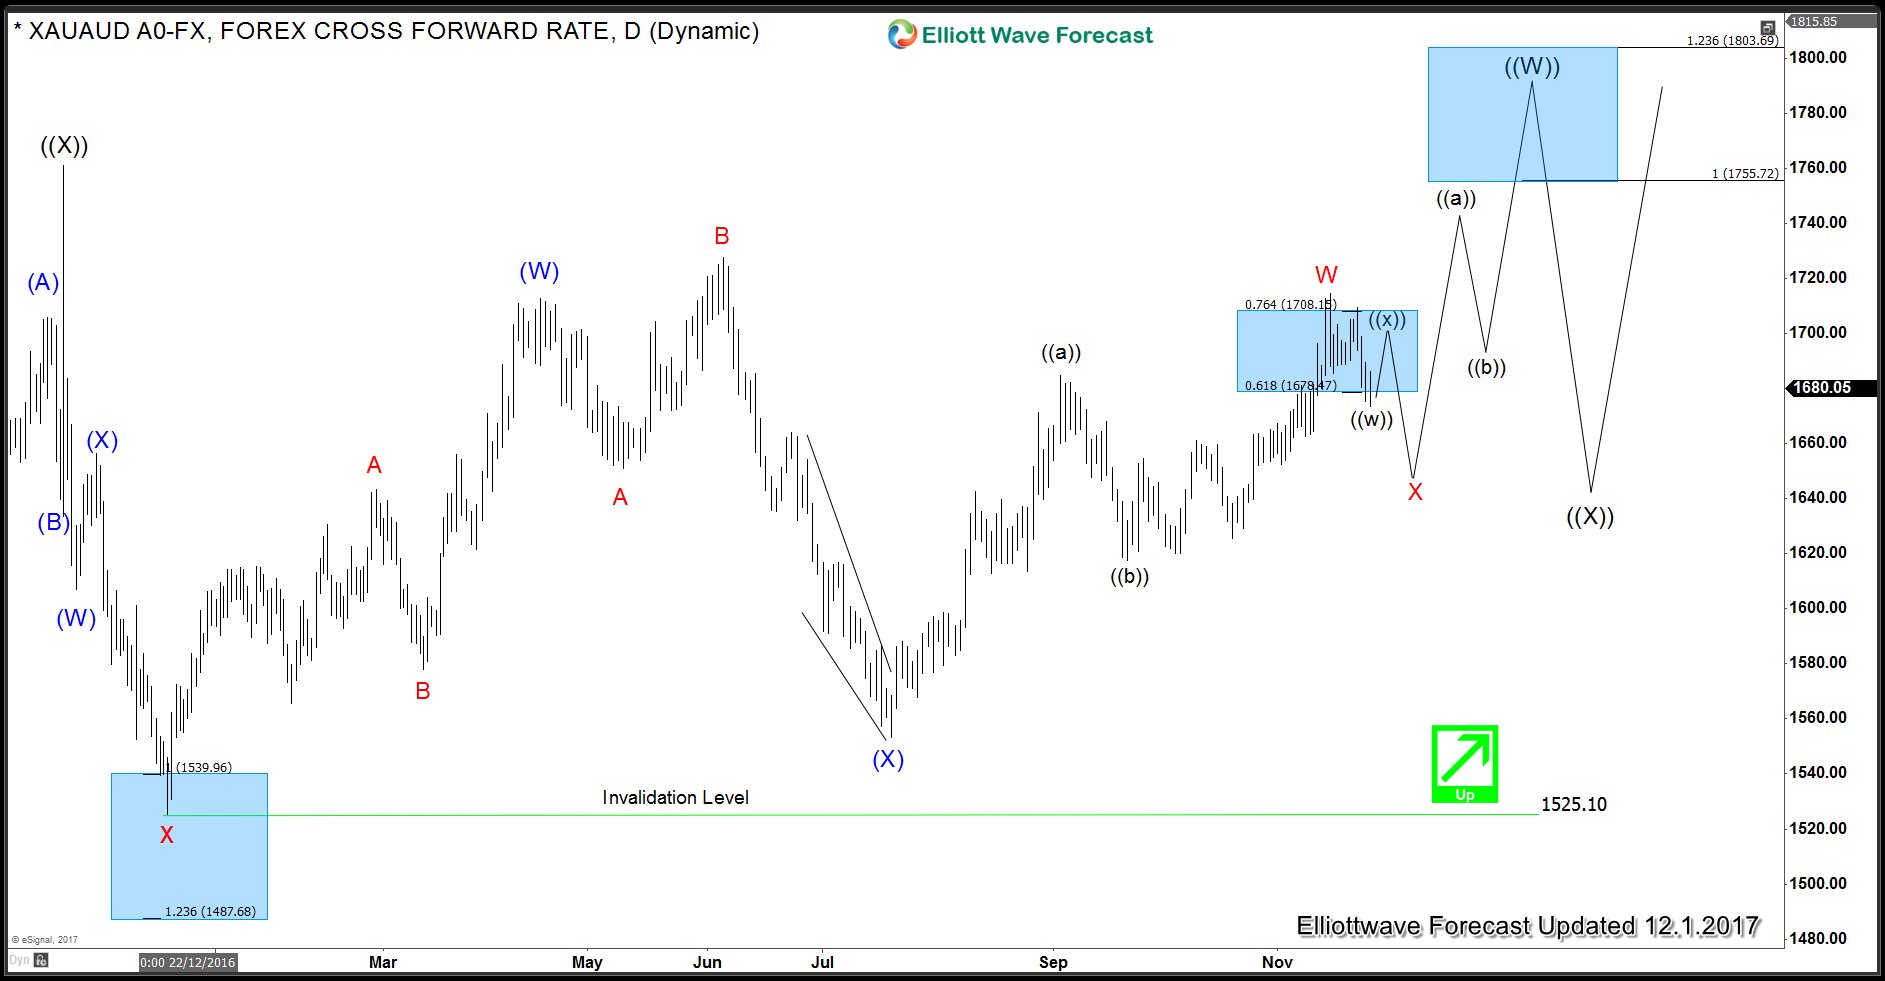
XAU AUD Elliott Wave View: 12.1.2017
We can see that the expected pull back in Summer of 2017 took the form of an Ending Diagonal and held above December 2016 low as expected. We have labelled the rally from December 2016 low to April 2017 peak as wave (W) and we have labelled the dip as a FLAT wave (X) completed at 7/20/2017 (1553) low. Subsequent rally was in 3 waves and has not yet broken above the peak of April 2017. Preferred Elliott Wave view is not expecting a 3 waves pull back in XAU AUD to correct the cycle from 1553 low before further upside is seen towards 1755 – 1803 area to end a cycle from December 2016 low. Then, we can see a higher degree pull back in wave ((X)) to correct the cycle from December 2016 low and higher again.
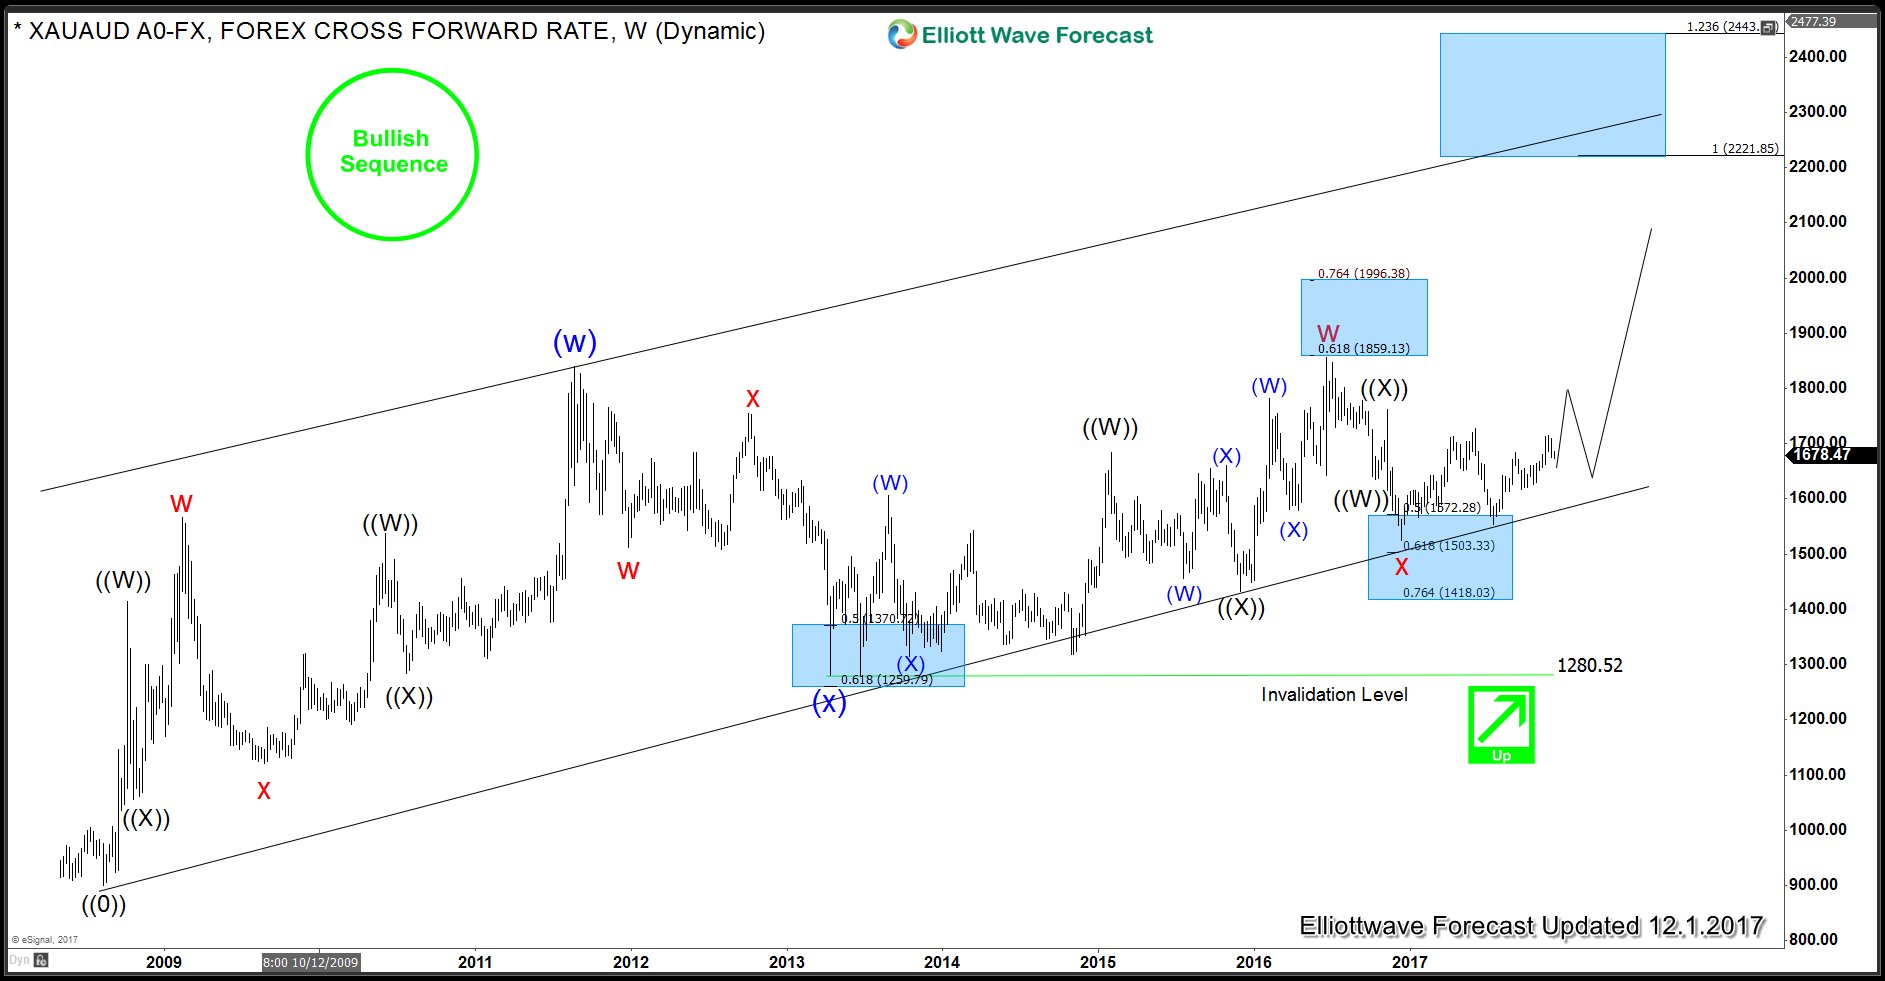
As a reminder, XAU AUD Weekly Sequence remains bullish and even though it would take a good few years but we do expect to see XAU AUD eventually reaching 2221 target area.
XAU AUD Weekly Elliott Wave Analysis
Back


