Hello fellow traders. In this technical blog we’re going to take a quick look at the past Elliott Wave charts of OIL ( CL #F ) published in members area of www.elliottwave-forecast.com. In further text we’re going to get through short term price structures and explain the Elliott Wave view.
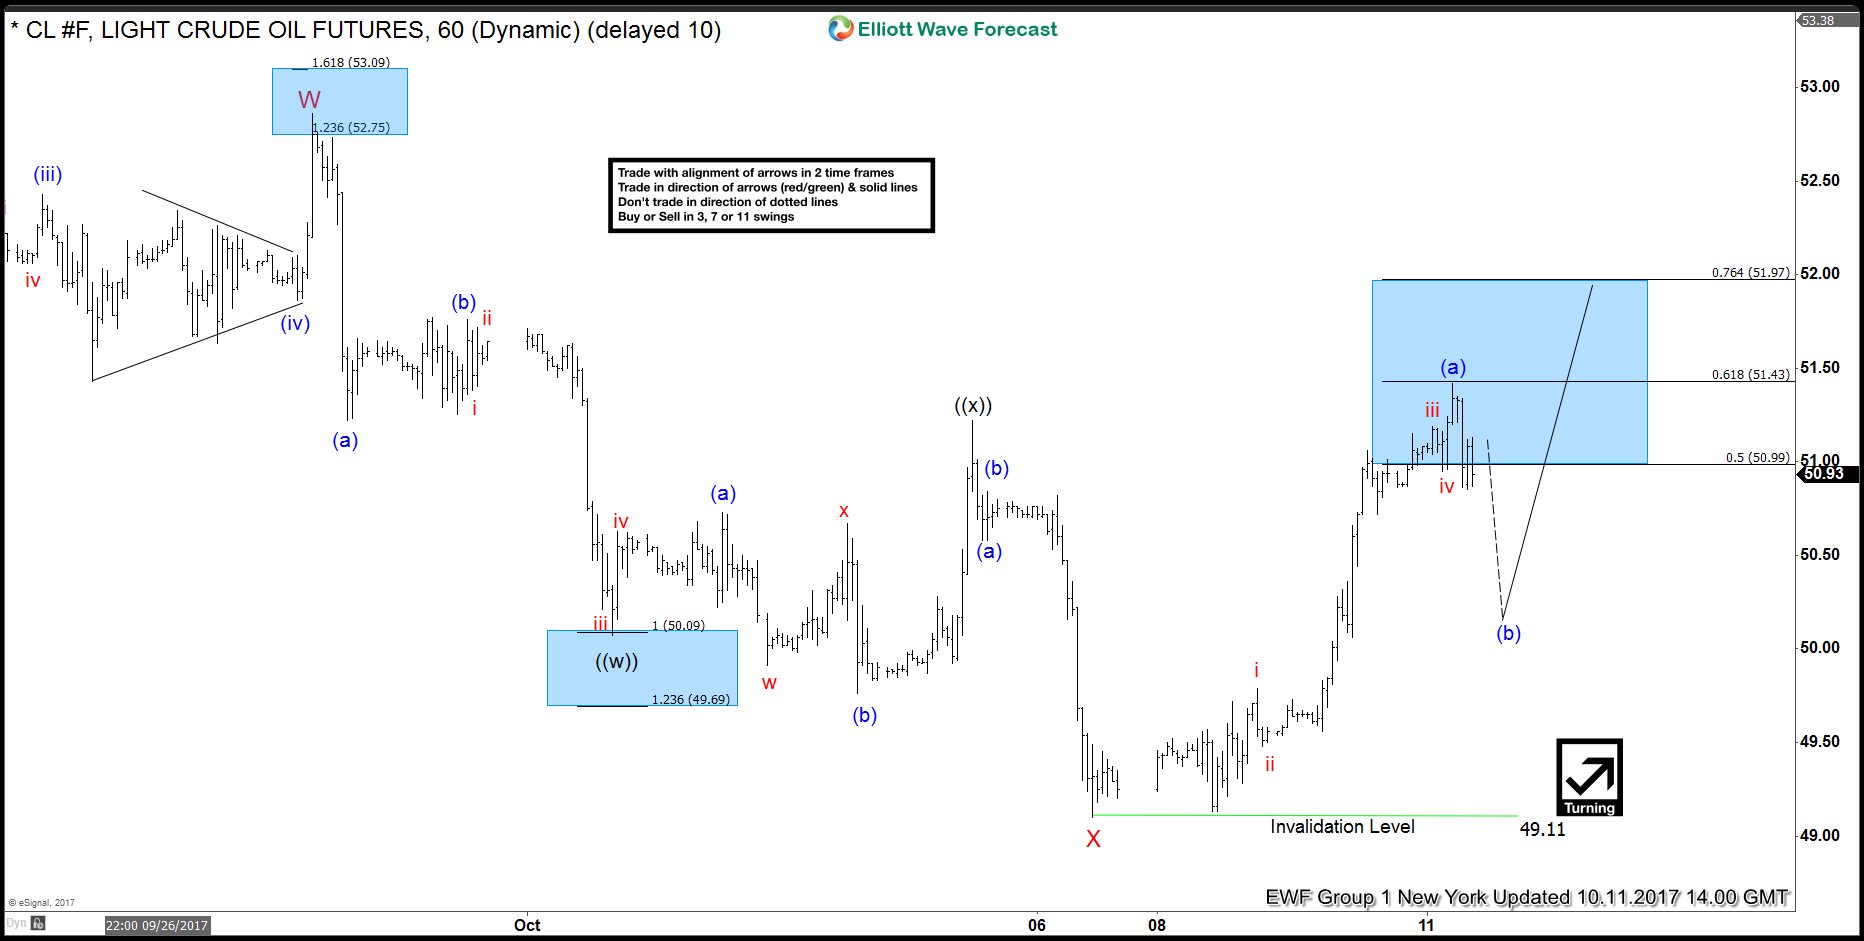
OIL Elliott Wave 1 Hour New York Chart 10.11.2017
As our members know, back then we were calling cycle from the 09/28 peak completed at 49.11 as truncated Double Three structure. Due to incomplete bullish swings sequences OIL have had in higher time frames we were expecting it to trade higher.
The price is giving us reaction from the 61.8 Fibo level against the peak. We’re expecting short term pull back in (b) to correct short term rally from the low. At this stage we’re labeling rally from the 49.11 low as 5 waves structure : wave (a) blue.
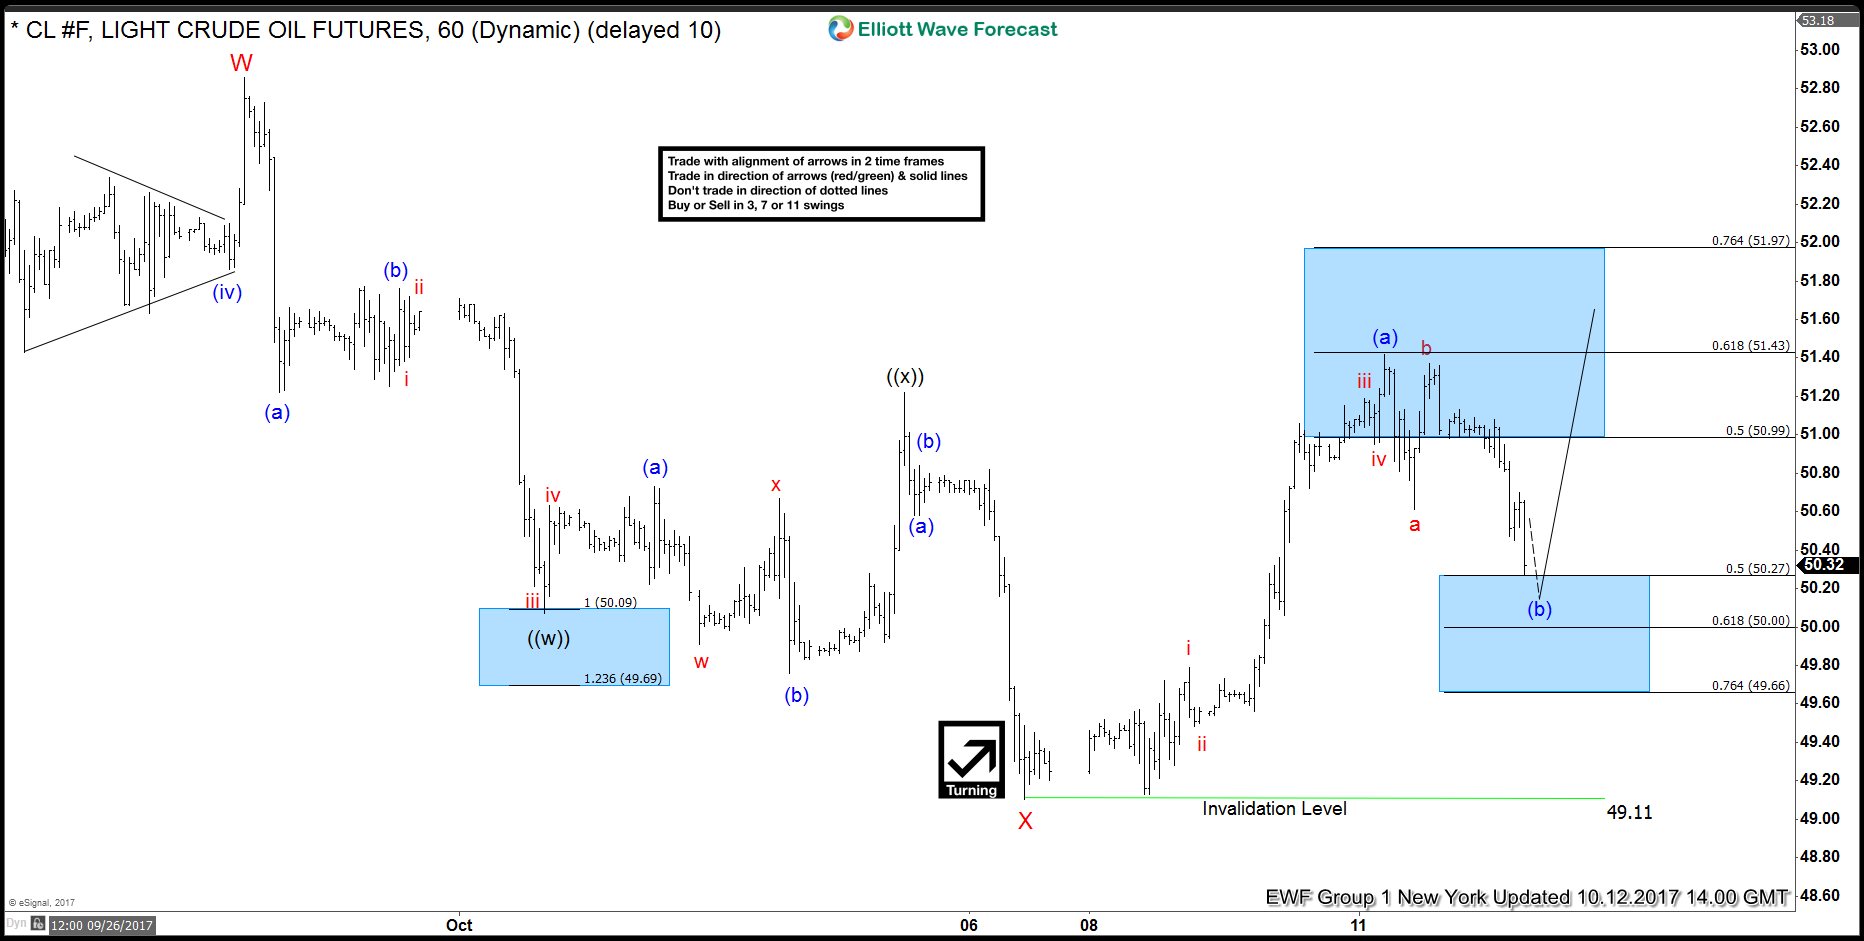
OIL Elliott Wave 1 Hour New York Chart 10.12.2017
We’re getting nice pull back in wave (b) as expected. The price is reaching 50 -61.8 Fibo Retracment area against the low at 50.27-50.00 . We expect buyers to appear there for further rally ideally. Although we expect commodity to trade due to its bullish sequences in higher time frame, we advised members to be carrefull with buying it, as it’s not showing short term tradable sequences.
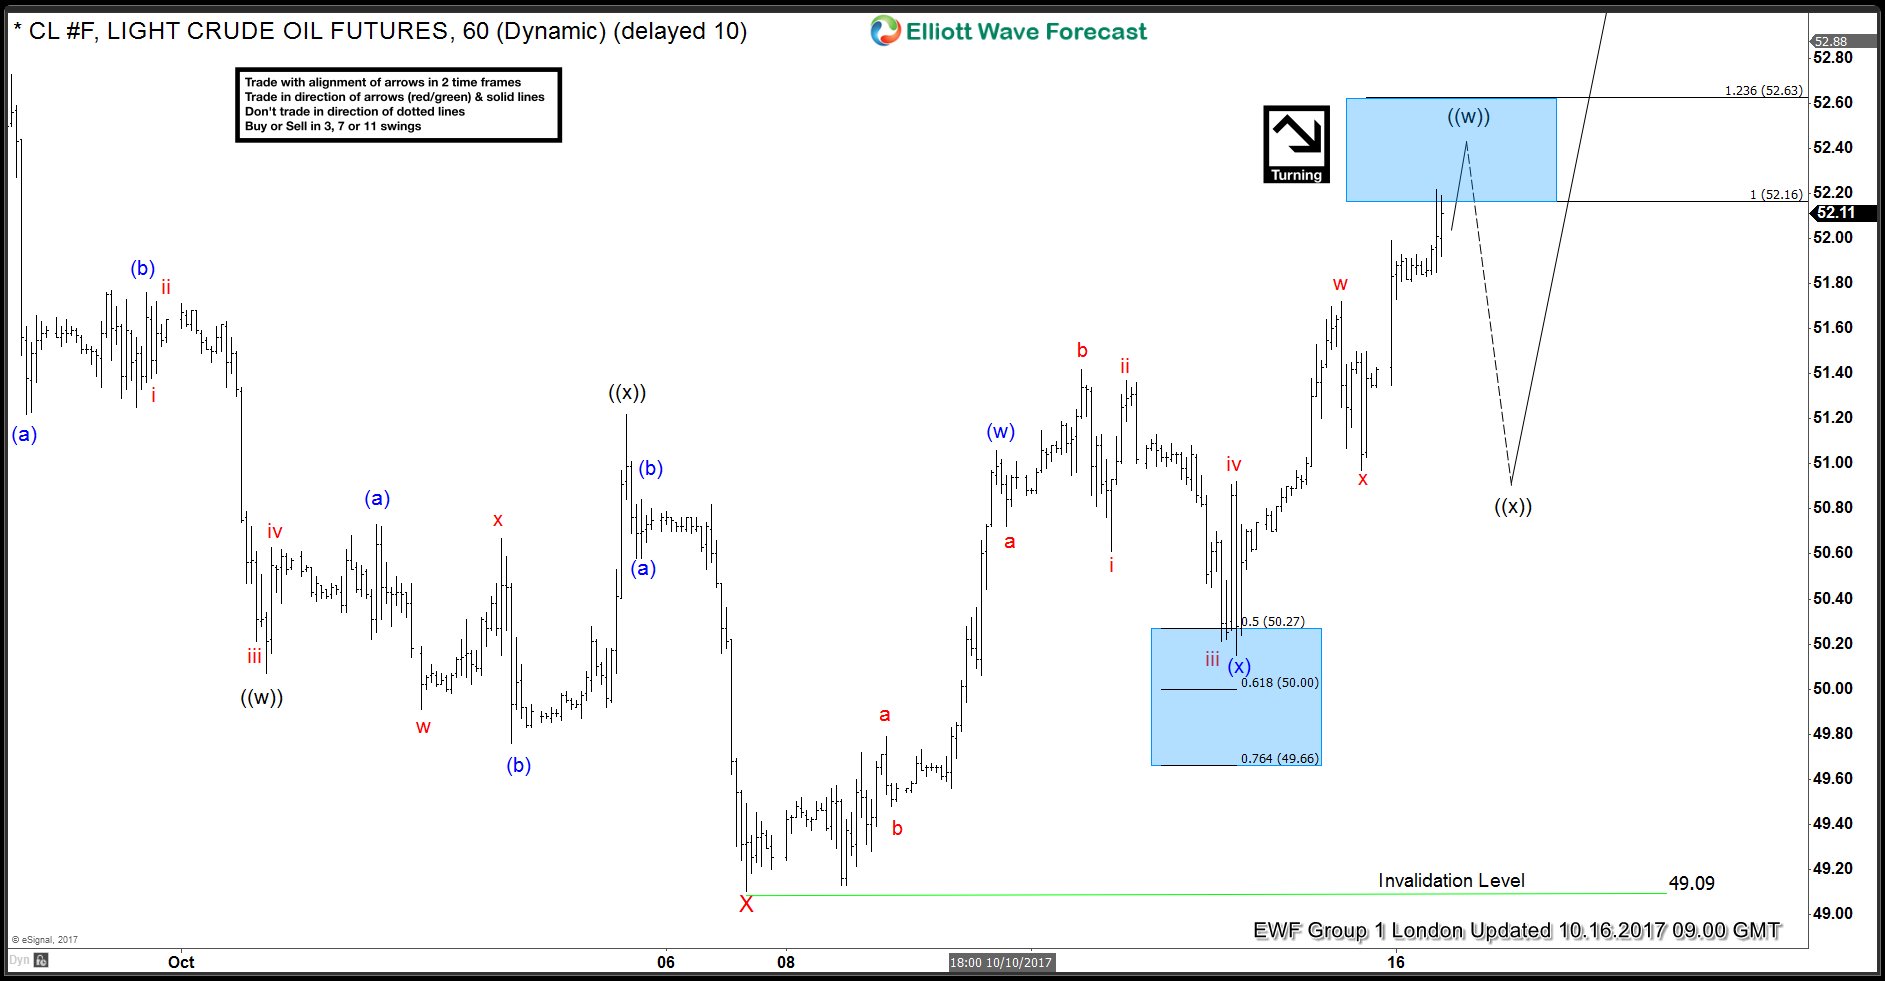
OIL Elliott Wave 1 Hour London Chart 10.16.2017
OIL found buyers at 50 -61.8 Fibo Retracment area (50.27-50.00) and gave us nice rally. Currently it’s at important technical area equal legs (w) related to (x) at 52.16-52.63 where buyers will be taking profit.
We knew that pull back should follow from that area, assuming that it can reach 50 Fibo retracment zone agianst the 49.09 low.
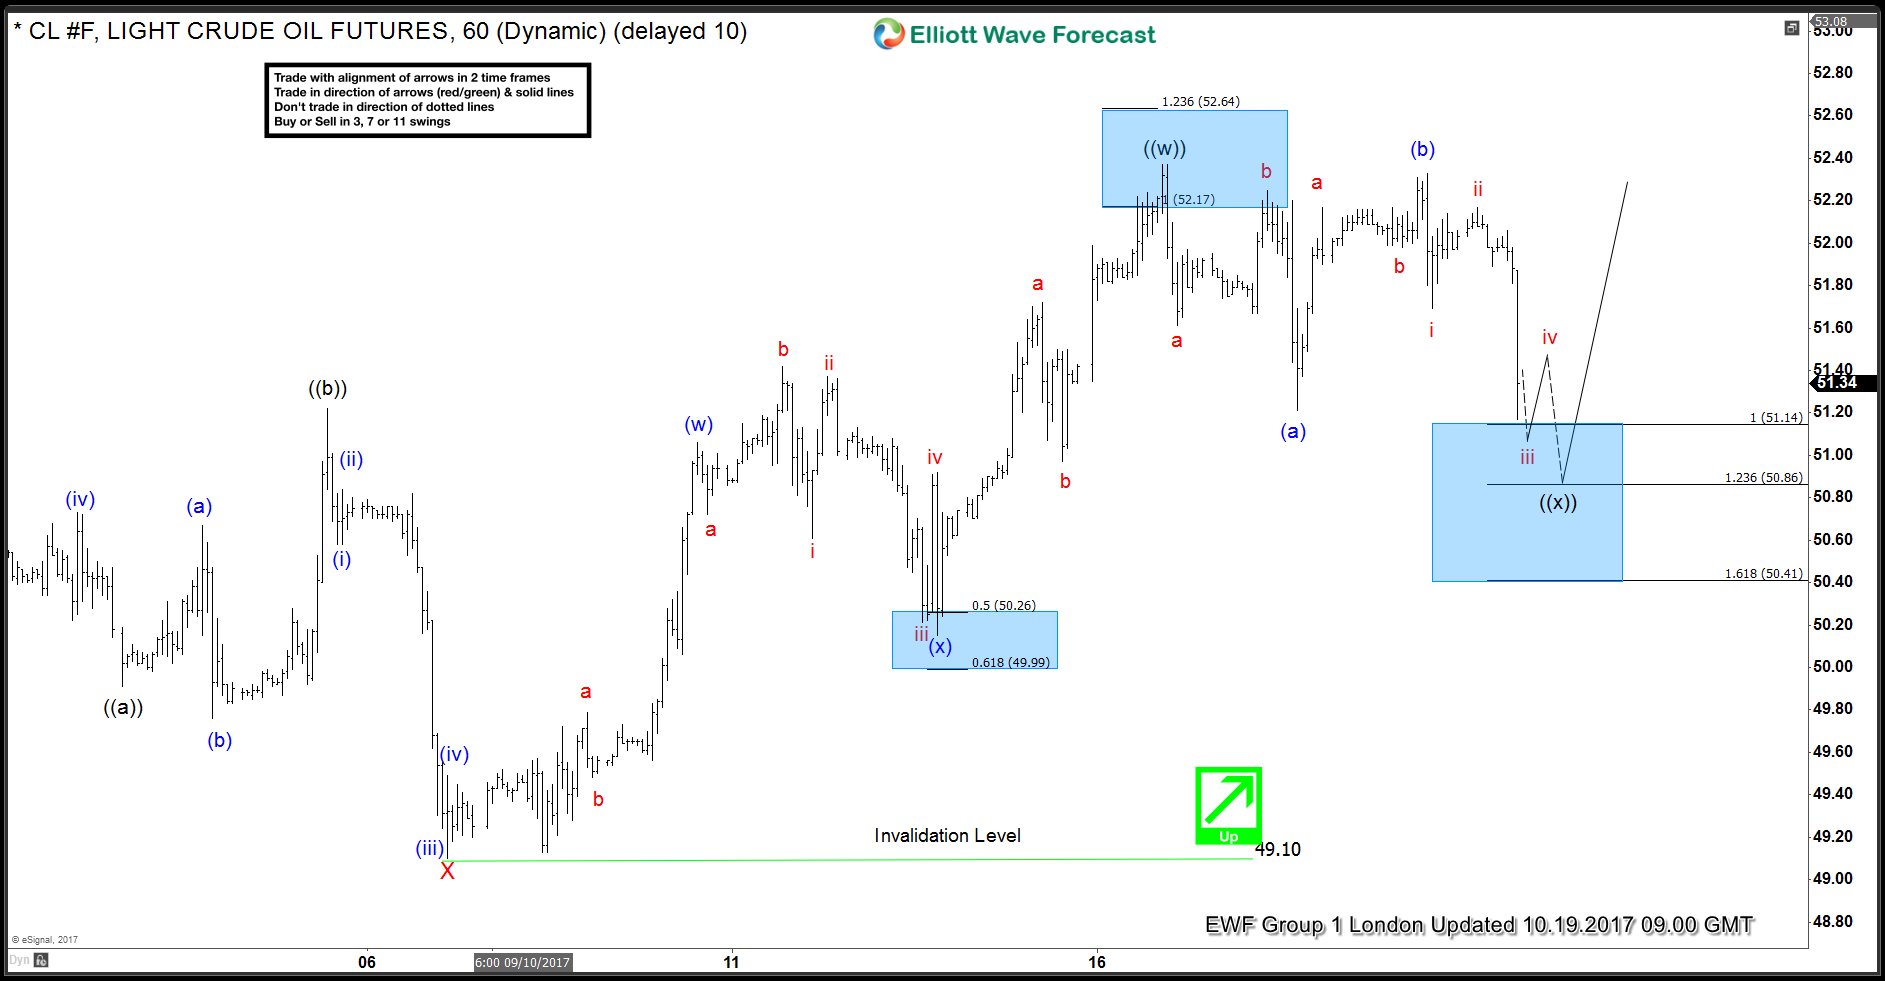
OIL Elliott Wave 1 Hour London Chart 10.19.2017
We got proposed pull back that’s reaching equal legs from the peak at 51.14-50.41. We expect buyers to appear again for further rally ideally or 3 wave bounce alternatively.
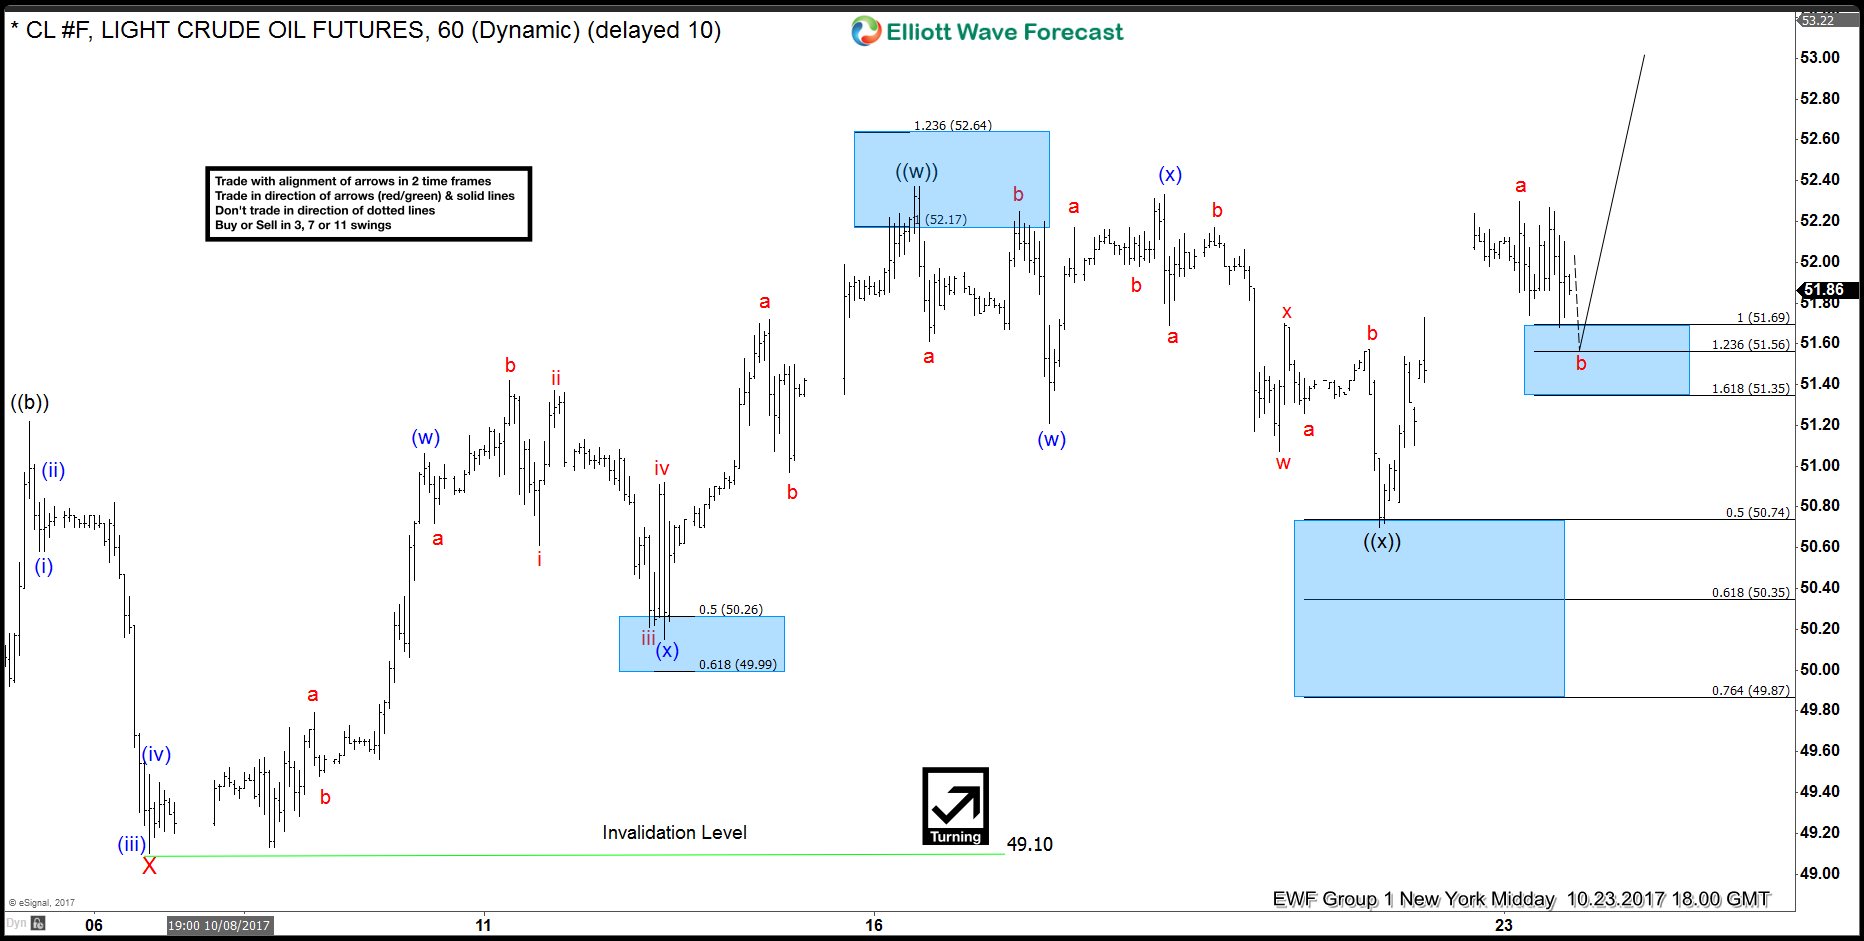
OIL Elliott Wave 1 Hour New York Midday Chart 10.23.2017
((x)) pull back extended little bit below 1.236 fibo extension and found buyers right at 50 Fibo retracement area :50.74. Currently doing short term pull back b red that is expected to find buyers at 51.69-51.56 area.
If you’re interested in new Elliott Wave forecasts of OIL you can find them in the membership area of EWF.
Elliott Wave Forecast
We cover 78 instruments in total, but not every chart is trading recommendation. We present Official Trading Recommendations in Live Trading Room. If not a member yet, Sign Up for 14 days Trial now and get access to new trading opportunities.
Through time we have developed a very respectable trading strategy which defines Entry, Stop Loss and Take Profit levels with high accuracy and allows you to make position Risk Free, shortly after taking it. If you want to learn all about it and become a professional Trader, join us now. Welcome to EWF !
Back