Cleveland-Cliffs (NYSE: CLF) formerly known as Cliffs Natural Resources is a mining and natural resources company with a focus on iron ore.
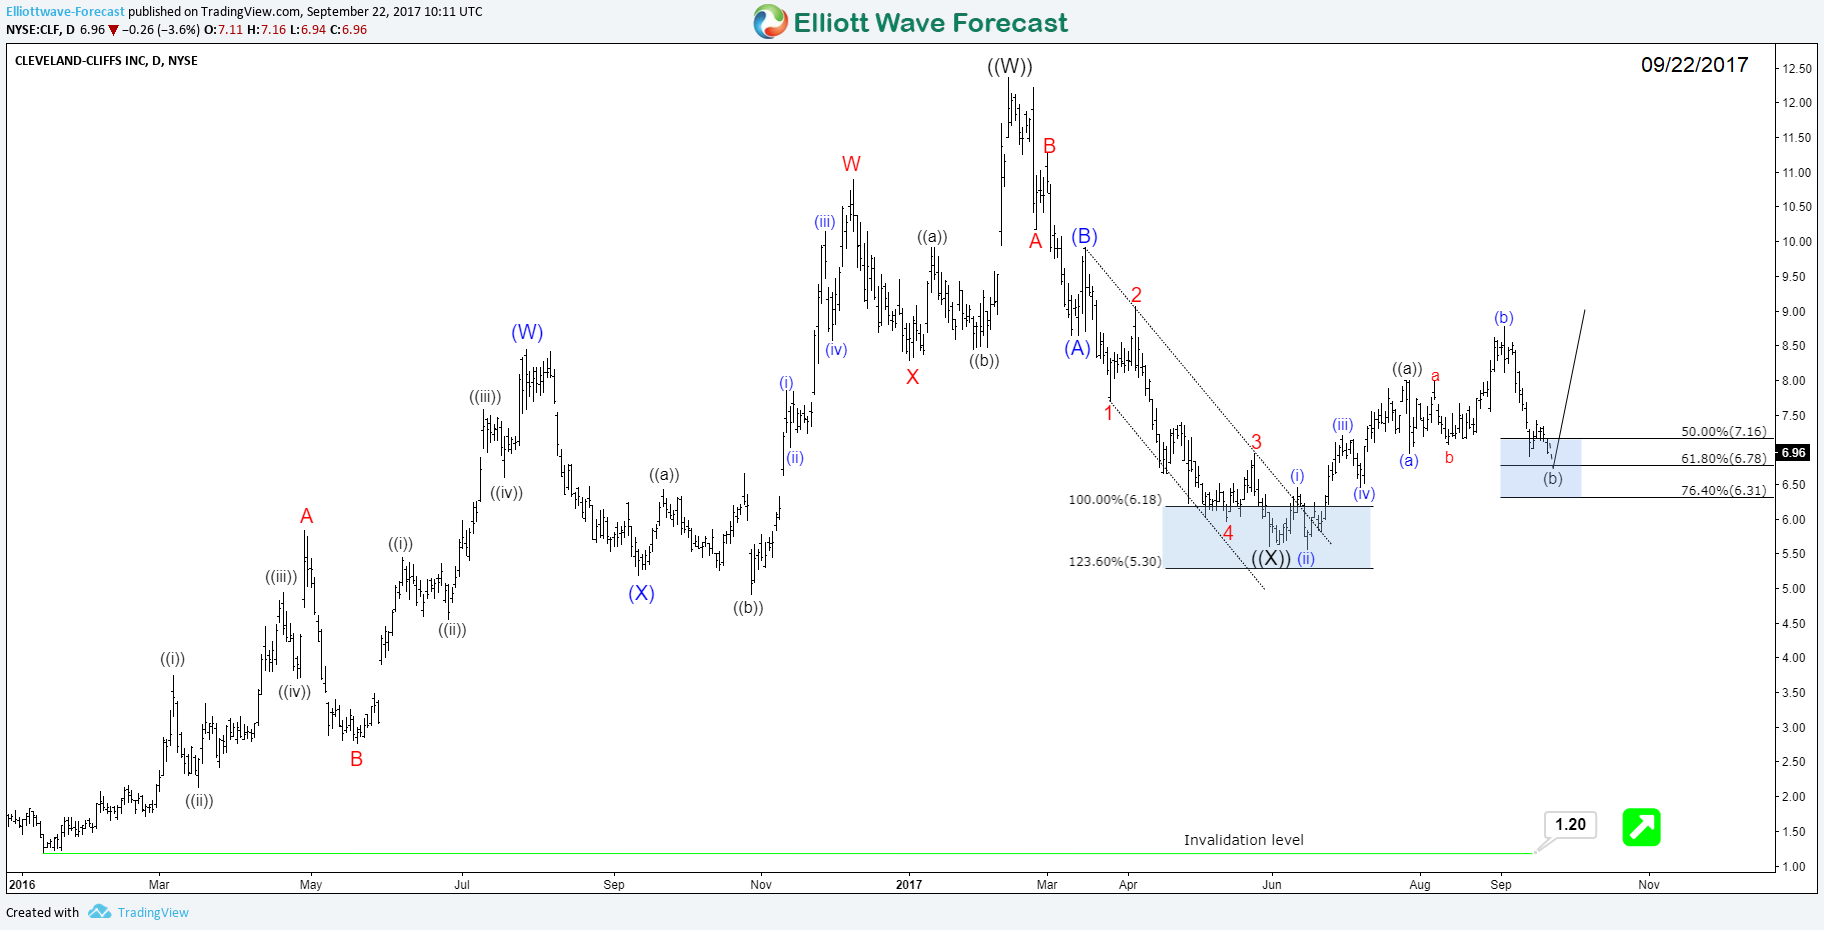
Let’s jump directly to the daily chart presented below showing the cycle from 01/12/2016 low which was a significant bottom for the stock. Up from there, CLF rallied in 7 swings structure forming a double three structure that ended at 100% area 12.17 before doing a 3 waves correction as a flat. The wave ((X)) pullback reached the buying blue box area at 100% – 123.6% fib ext area 6.16 – 5.28 and bounced higher from there.
Currently, CLF is doing a flat correction against 06/15 low (5.56) reaching the 50% – 76.4% Fibonacci retracement area (7.16 – 6.31) where it’s expected to resume higher as long as that low keeps holding, then we expect the stock break above 2017 peak and open an extension higher toward 16.72.
If the stock fails to break above 02/13 peak (12.37) or the pivot at 5.56 low fails, then it could still make the double correction lower in wave ((X)) against 2016 low (1.20) low before it can find buyers again at the next extreme area. It’s not recommended to sell CLF at current stage.
CLF Daily Chart
We launched a new plan covering 26 Stocks & ETFs , so if you’re interested in getting more insights about Mining stocks like FCX or any other related instruments like GDX then take this opportunity and try our services 14 days to learn how to trade forex, indices, commodities and stocks using our blue boxes and the 3, 7 or 11 swings sequence. You will get access to our 78 instruments updated in 4 different time frames, Live Trading Room and 2 Live Analysis Session done by our Expert Analysts every day, 24-hour chat room support and much more.
Back


