Amazon (NASDAQ: AMZN) is one of the strongest companies providing positive returns to its investors in the recent decade . Last week AMZN managed to make new all time highs after breaking above October 2016 peak , this move opened an extension higher as the stock is now showing an incomplete bullish sequence from February 2016 low and should extend more to the upside while the pivot at November 2016 low keeps holding.
The stock minimum target remain at $883 which is the equal legs level from October 2014 low and it can slow down around that area . Looking at the daily chart , we’ll be presenting 3 bullish Elliott Wave Scenarios starting from the most aggressive approach to the less bullish one :
Amazon Scenario 1 :
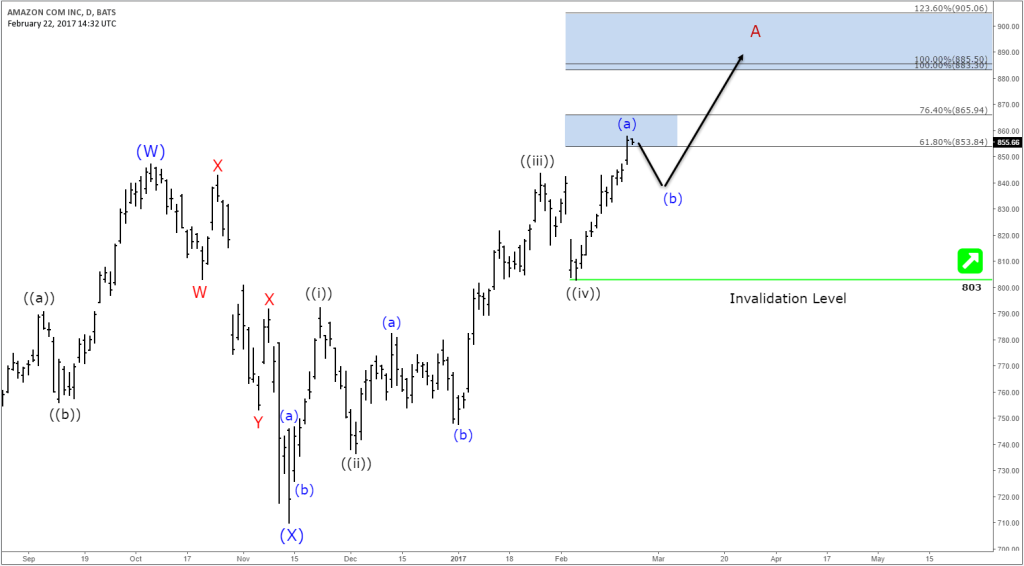
AMZN currently did see a pullback in wave (b) and still needs to break above the previous peak to resume higher toward the equal legs area $885-$905 where it can be ending wave A as a leading diagonal structure from November lows and start a 3 waves pullback . The stock can still make the double in wave (b) but the pivot at $803 low needs to keep holding for the stock to extend higher .
Amazon Scenario 2 :
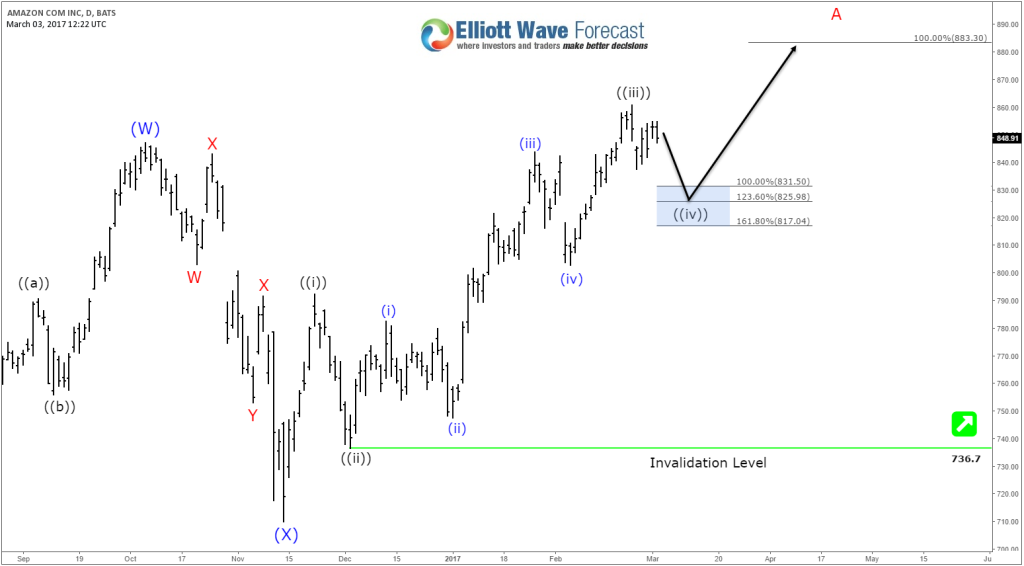
If $803 pivot fails then AMZN could have ended wave ((iii)) at the recent peak and currently doing wave ((iv)) pullback as a double three structure looking to reach equal legs area $831-$825 before resuming higher toward $883 target where it will be ending 5 waves and should see then 3 waves pullback.
Amazon Scenario 3 :
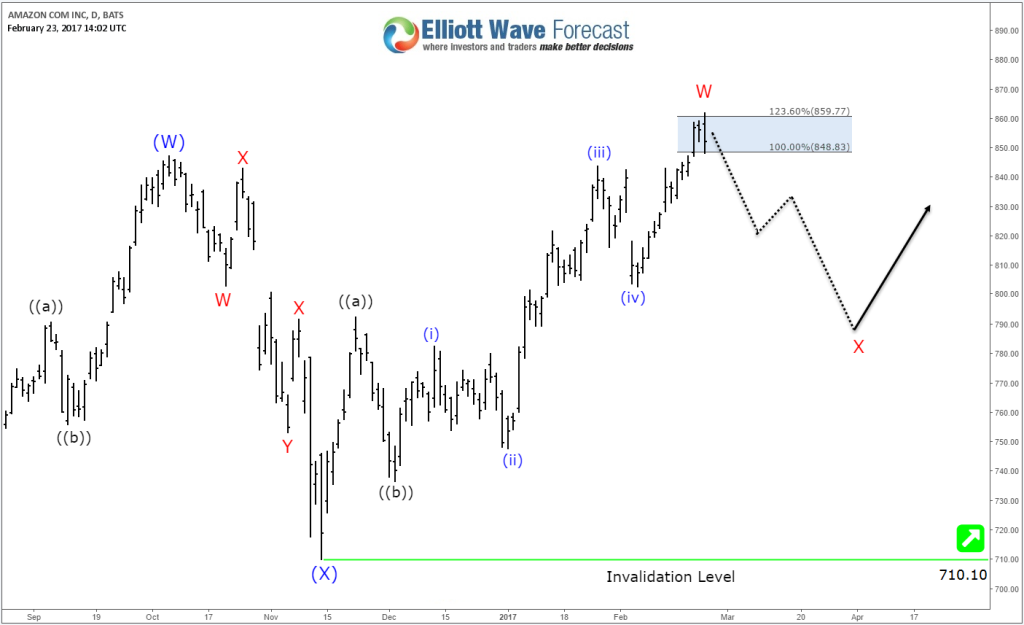
The less bullish path would be if AMZN already ended the cycle from November 2016 low as 3 waves Flat structure and already started the correction which means a larger pullback can be seen that could reach the 50% area around $785 . But then the stock will still remain supported as long as pivot at $710 low remain in place still looking for a move to the upside.
Recap :
Amazon cycle from both October 2014 & February 2016 is still alive as the stock managed to make new highs and showing a bullish sequence from those lows looking for a first target around $883 area and can extend later all the way to reach $1083 level . So the short term pullbacks should remain supported and find buyers at least for a 3 waves bounce .
If you enjoyed this article, feel free to take a look at our Technical Blog and also check the Chart of The Day .
For further information on how to trade forex, indices, commodities and stocks using Elliott Wave technique , try us 14 days for FREE . You will get access to our Professional Elliott Wave analysis in 4 different time frames, Daily Elliott Wave Setup Videos , Live Trading Room and 2 Live Analysis Session done by our Expert Analysts every day, 24 hour chat room support, Weekly Technical videos and much more so if you are not a member yet, use this opportunity and sign up to get your FREE trial .


