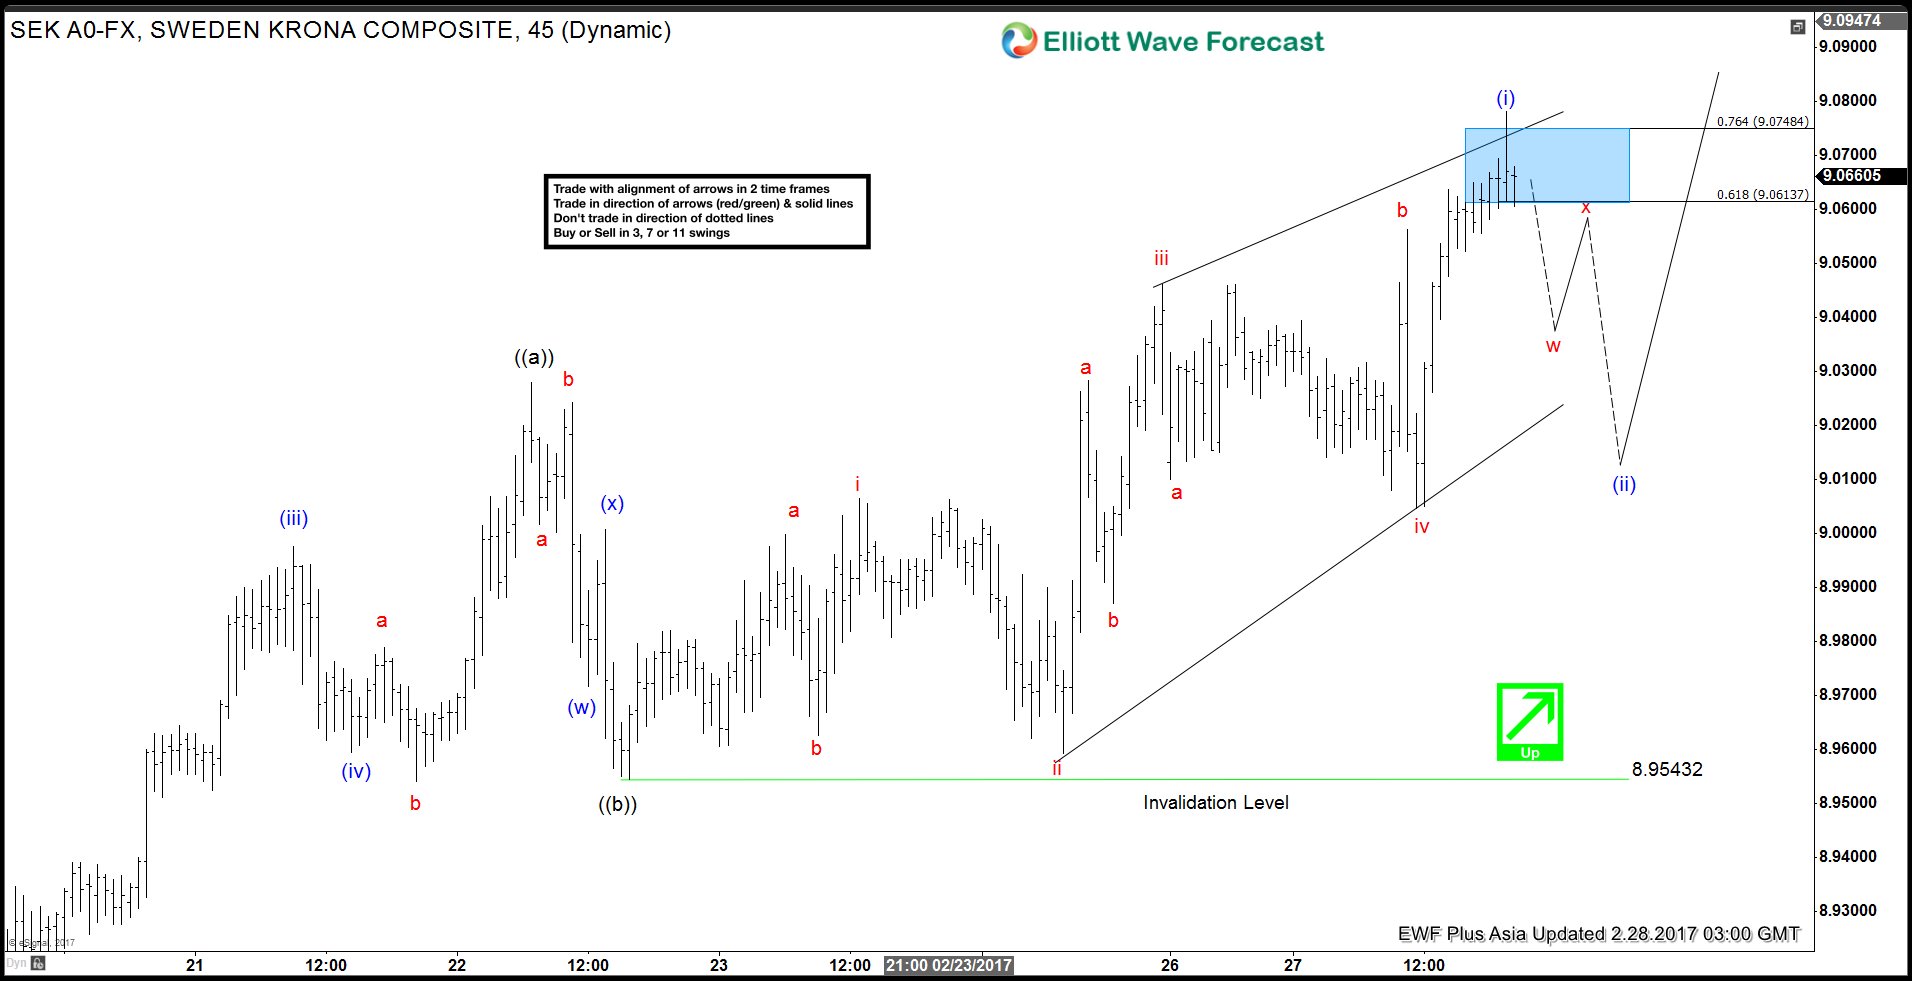
USDSEK move up from 2/22/2017 (8.9543) low could be viewed as 5 swings and hence we are labelling it as a leading diagonal Elliott Wave structure in wave (i). In the 2/28/2017 Asian update, we were expecting the pair to complete wave (i) and make a pull back in wave (ii) which would be a correction of the rally from black wave ((b)) low.
USDSEK 1 Hour chart: 2/28, 3:00 GMT
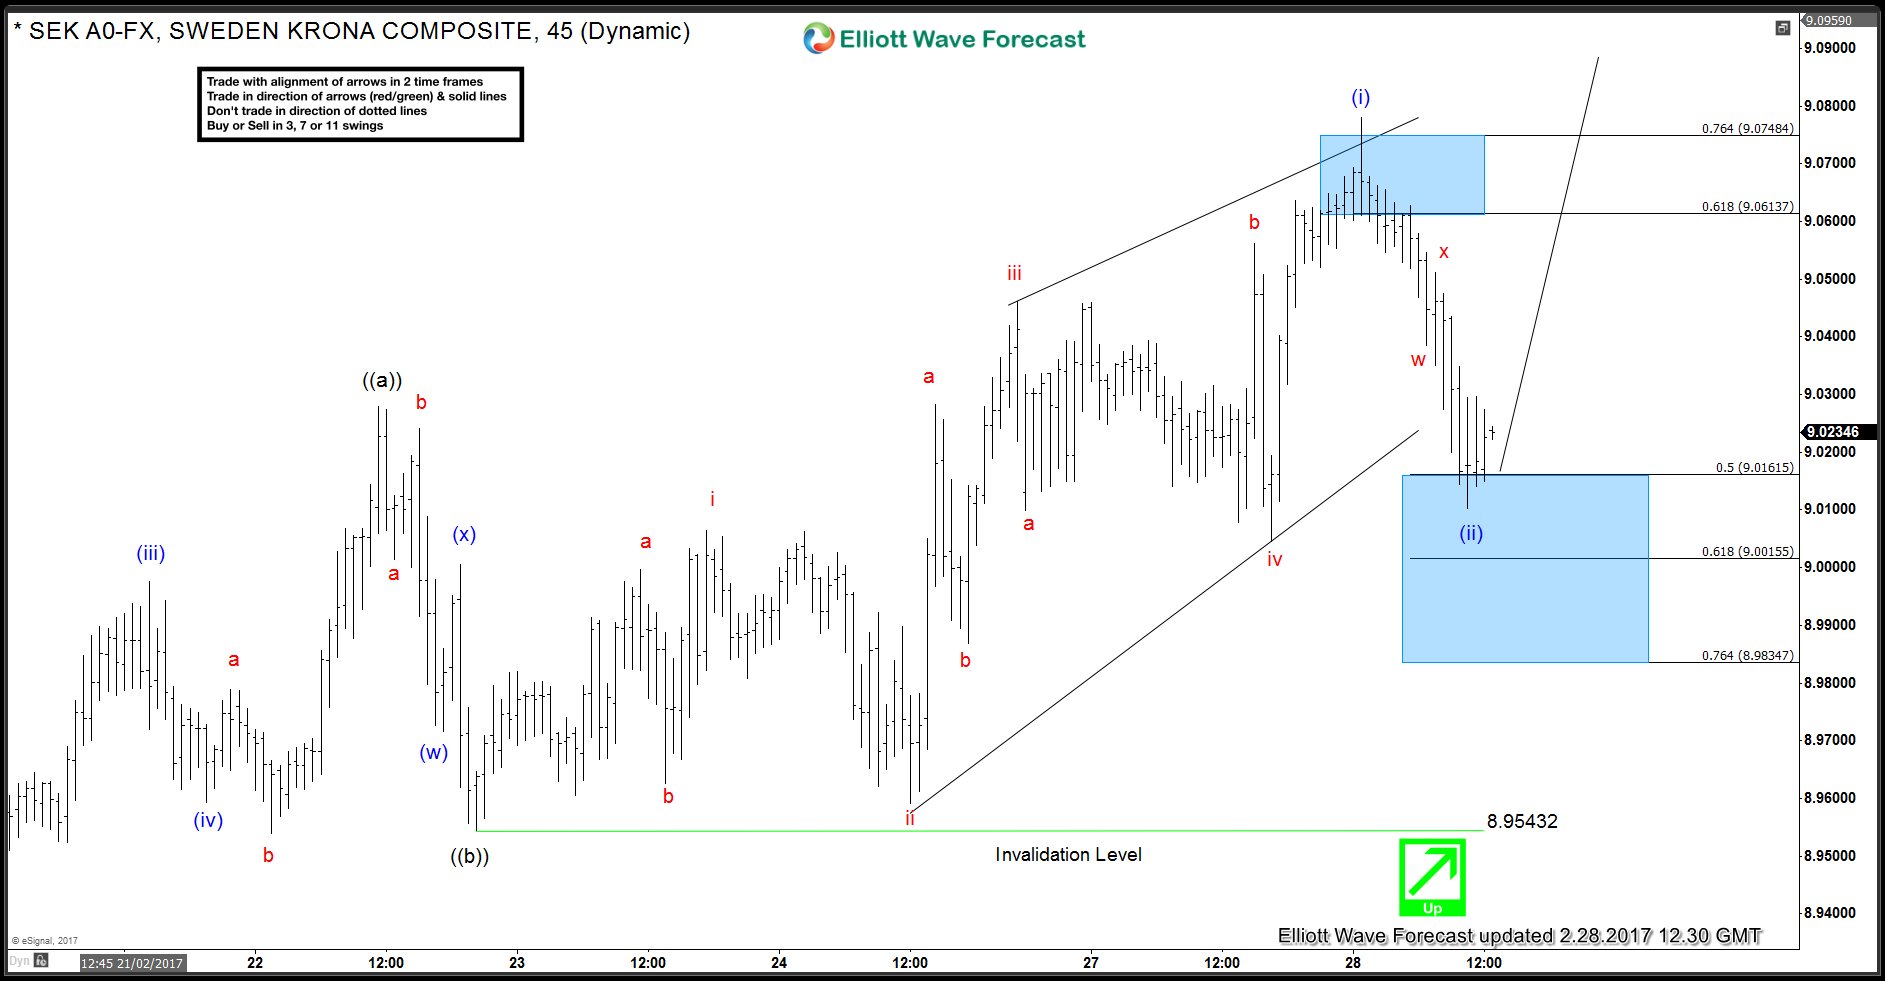
Pair completed proposed wave (i) in the highlighted blue box area and pulled back. Pair has areached 50% Fibonacci retracement (9.0161) of proposed wave (i) rally and has also reached 100% Fibonacci extension (9.0115) of waves w-x from the peak. There are enough number of swings in place to call wave (ii) pull back completed at 9.0102 and we can see the pair start the next leg higher in wave (iii).
USDSEK 1 Hour Chart: 2/28, 12:30 GMT
In case of a break below 9.0102, next levels of interest would be 61.8 Fibonacci retracement (9.0015) followed by 76.4 Fibonacci retracement level (8.9834) but price should stay above black wave ((b)) low (8.9543) for this view to remain valid. Only a break of the low or pivot at 8.9543 would negate this view and then wave ((b)) could become an Elliott Wave FLAT structure. Break above 9.0781 high would confirm proposed wave (iii) is in progress and once completed, pair should make another pull back in wave (iv) and another rally in wave (v) to complete wave ((c)). Ideal target for wave ((c)) to complete would be the 100% extension of ((a))-((b)) at 9.14. If the move up loses it’s impulsive nature, then the entire rally from 8.9543 low could take the form of an Ending Diagonal structure also. Push higher in USDSEK can support US Dollar Index against other pairs as well.
Back


