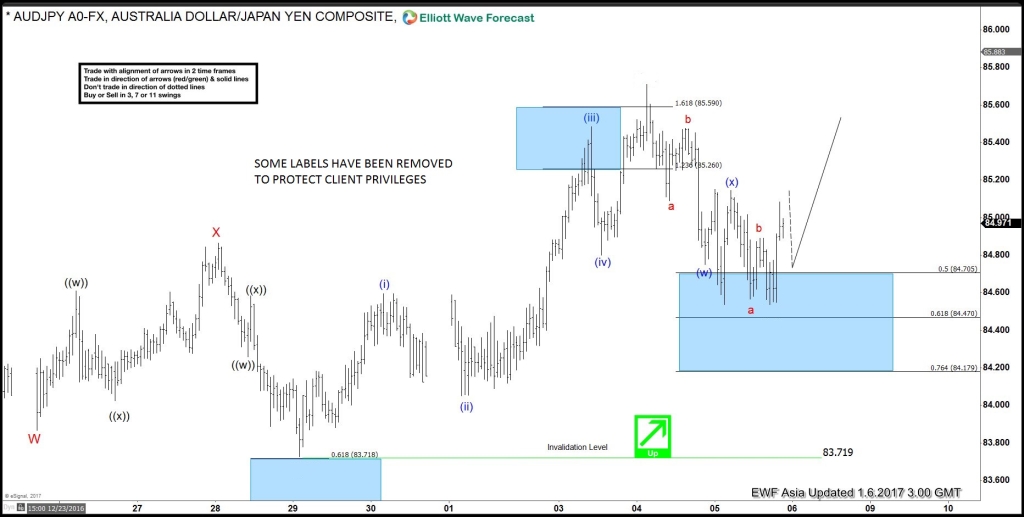
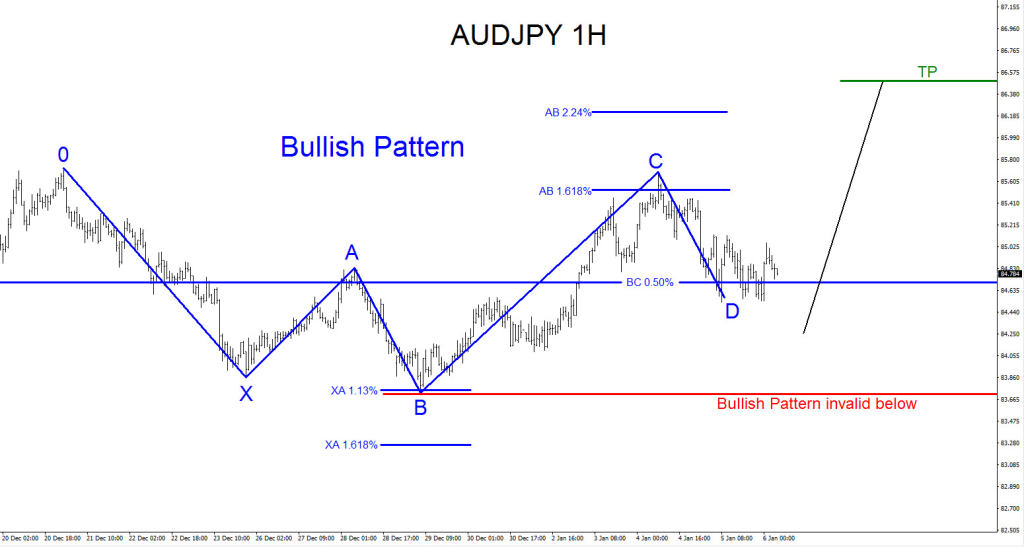
AUDJPY Technical Analysis: Elliott Wave count on the 1 hour chart calling for possible move higher together with a bullish pattern (blue) also calling for move higher. Both the Elliott Wave count and blue bullish pattern invalidates at the 83.71 level. As long as the pair stays above 83.71 we can expect it to extend higher.
AUDJPY 1 Hour January 6/2017 Bullish Elliott Wave Count
Elliott wave Analysis on the chart below shows pair completed a cycle from 83.71 low and then pull back in 3 waves to 50 – 61.8 Fibonacci retracement area of the rally from 83.71 low. Pair is expected to turn higher from current levels but in case of another low, price must stay above 83.71 low for the pair to continue higher. A break below 83.71 low would invalidate this Elliott wave count.
AUDJPY 1 Hour January 6/2017 Bullish Pattern
Showing a bullish ABCD pattern when point D appears to be in place and we can see the pair rallying from current levels and green line around 86.50 area on the upside would be the target for this bullish pattern. In case of another low, price must stay above the red line which is placed at the blue B low. A break below the red line which acts as the Bullish pattern’s invalidation line would invalidate the pattern.
*** Always use proper risk/money management according to your account size ***
At Elliottwave-Forecast we cover 52 instruments (Forex, Commodities, Indices) in 4 different time frames and we offer 3 Live Session Webinars everyday. We do Daily Technical Analysis Videos, Elliott Wave Trade Setup Videos and we have a 24 Chat Room. Our clients are always in the loop for the next market move.
Try Elliottwave-Forecast for 14 days FREE !!! Just click here –> 14 day FREE trial
Back


