At the begining of September 2016 $NZDUSD reached daily extreme area at 0.7389-0.7557 and our view was suggesting potential pull back in 3 waves against the January 20th low at least. The pair found sellers at the mentioned technical area and made top on September 7th ( 0.74882 peak) and since then it traded lower. In this technical blog we’re going to take a quick look at past h1 EWF’s charts of NZDUSD, to see how we guide our members through this currency pair.
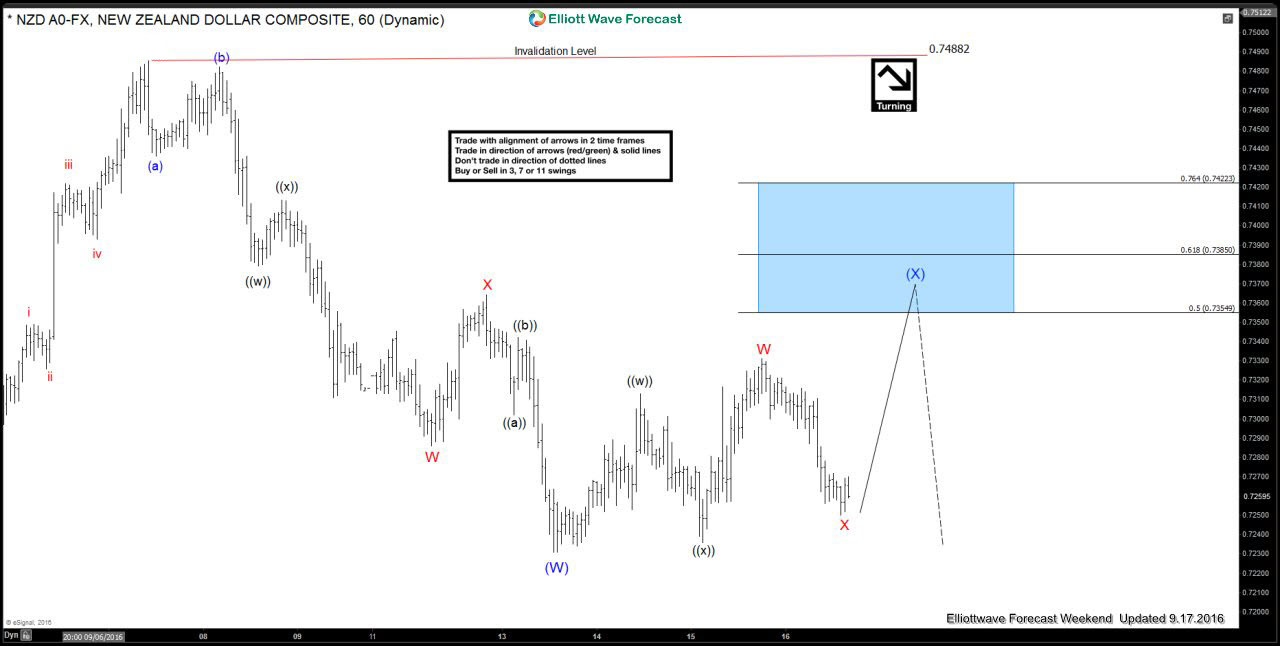
$NZDUSD Weekend Update 9.17.2016 Our Elliott wave chart suggested that pair is doing (X) blue recovery against the 0.74882 peak with potential to make double WXY red toward 50-61.8 fibs zone : 0.73549-0.7385 area, where sellers will be waiting for further decline.
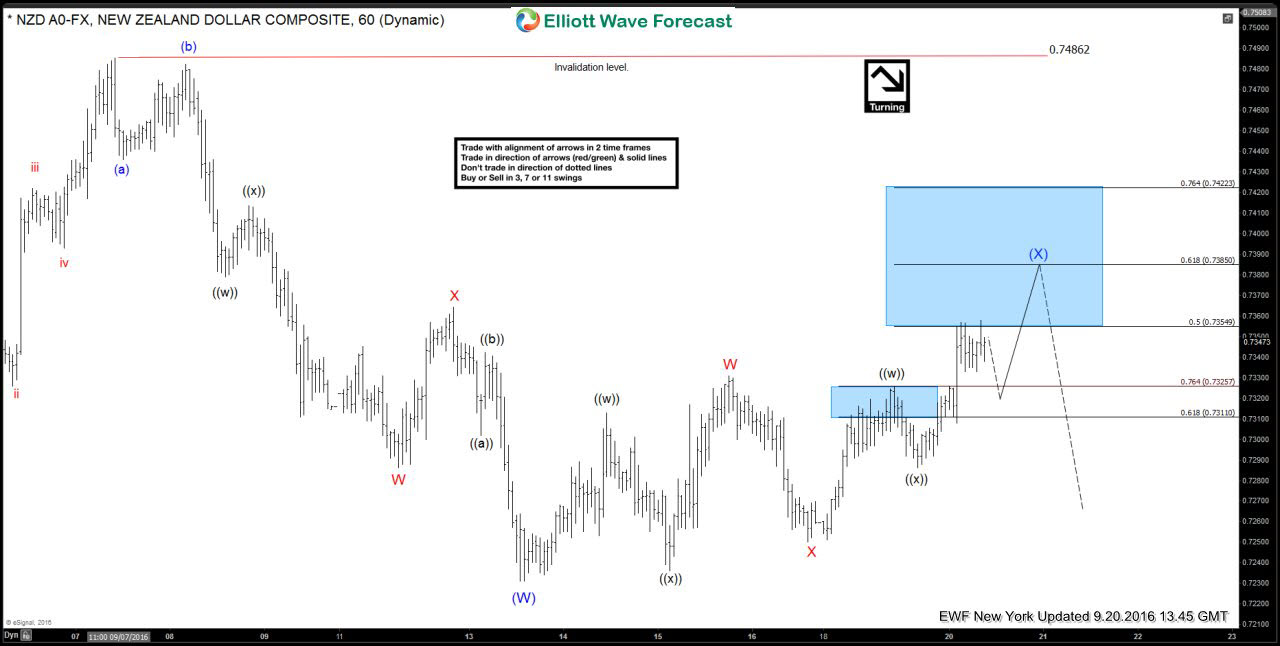
$NZDUSD NY Midday 9.20.2016 The pair made proposed leg up in wave Y red , reached 50 fibs area as expected and started making reaction from there.
$NZDUSD NY Update 9.23.2016 First reaction from 50 fibs is marked on the chart as wave iv red, we got another marginal high and decline from the same area. The price made new low, however it was already at the short term tech area from where it was expected to make a bounce against the 0.73698 peak, marked as (x) blue.
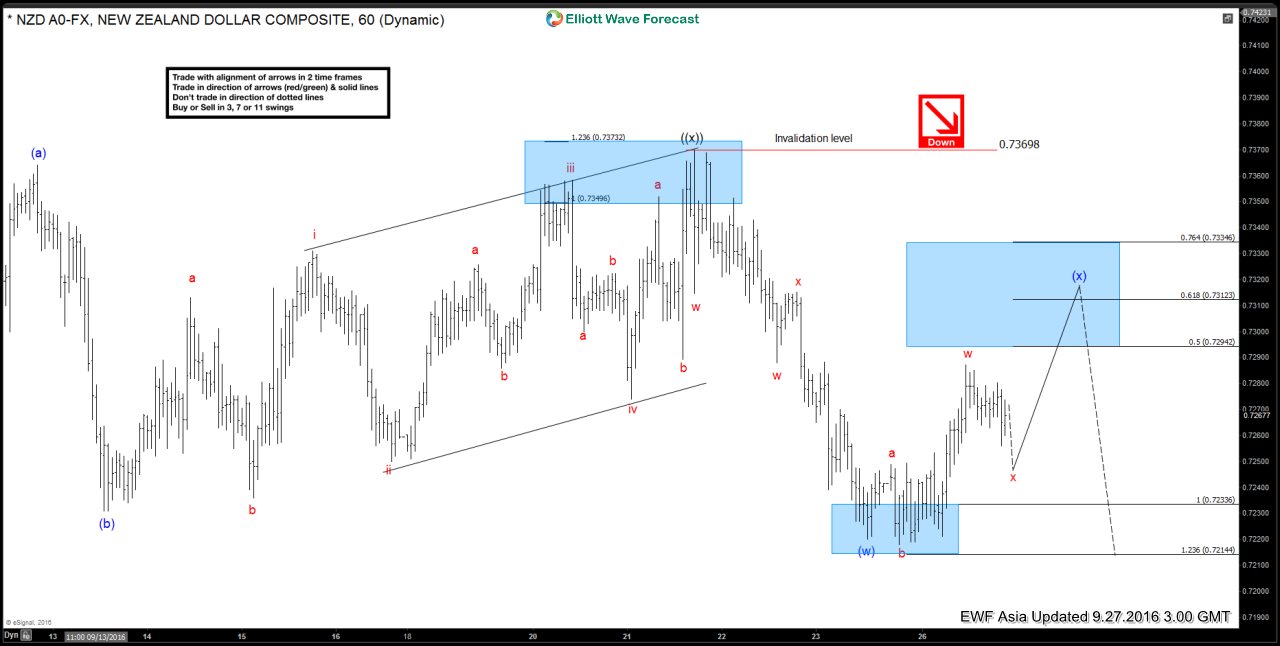
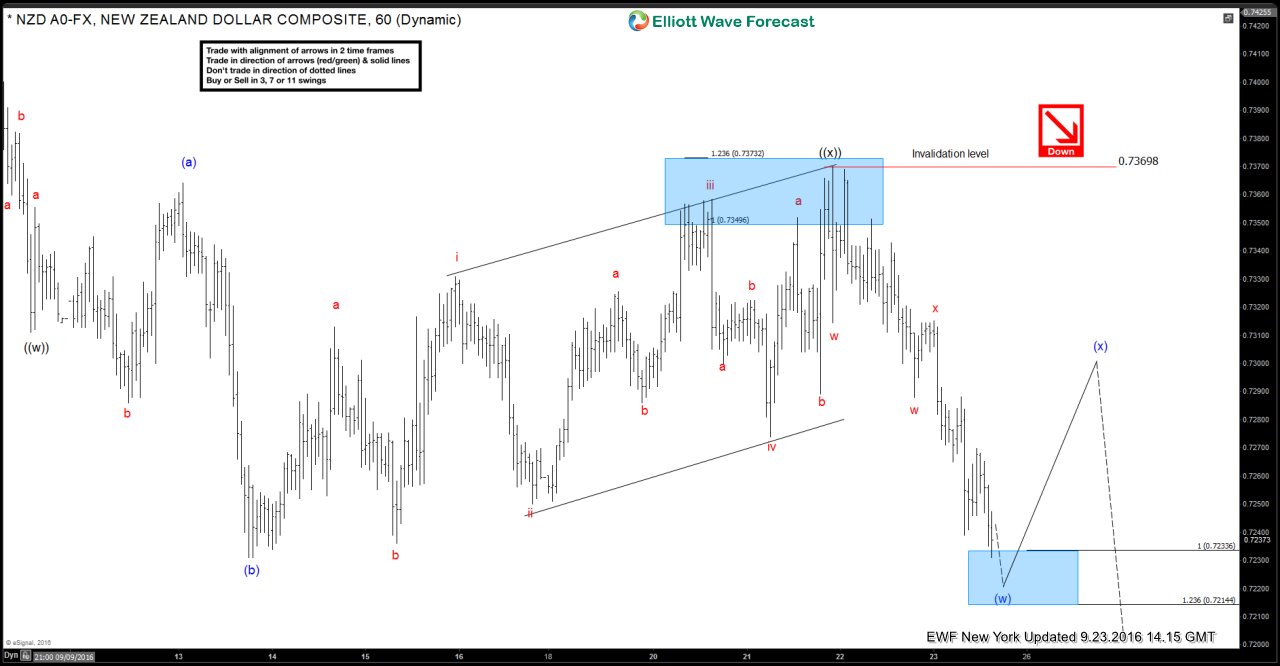 $NZDUSD Asia Update 9.27.2016 Proposed (x) blue bounce is in progress, looking for 0.7294-0.73346 (potential sell area) , before further continuation lower resumes.
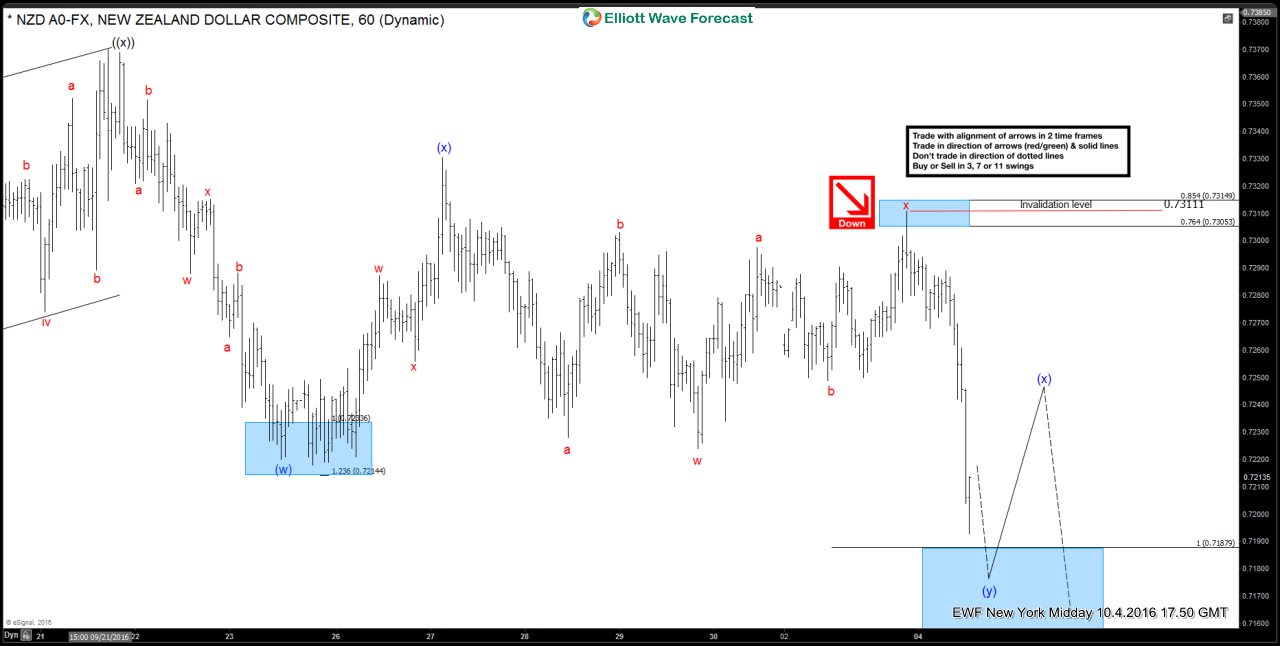
$NZDUSD NY Midday The pair completed (x) blue at 0.73294 , short term recovery x red at 0.7311 and keep pushing lower. On October 4th new low was made. Elliott Wave chart is calling the price still bearish against the 0.73294 peak.
 $NZDUSD NY update 10.7.2016 The pair was staying sideways to lower and made finaly another bounce, marked as wave iv red. Due to a price structure short term Elliott wave count has been change a little bit, but still calling for at least another leg lower.
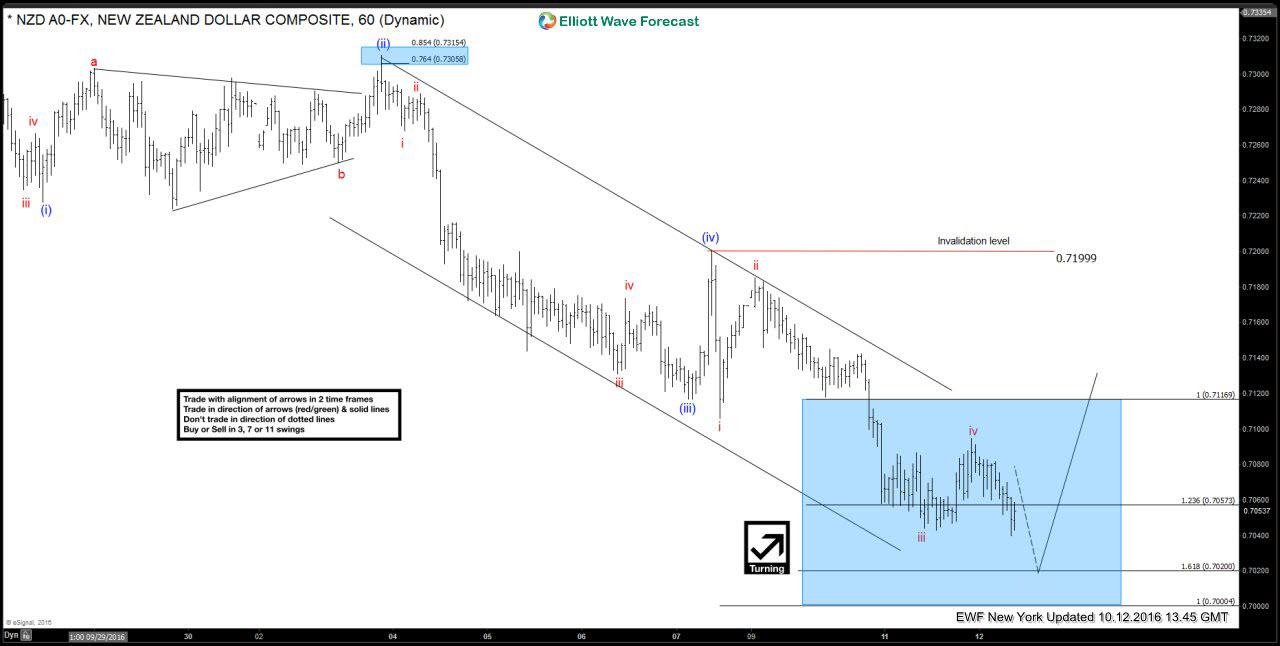
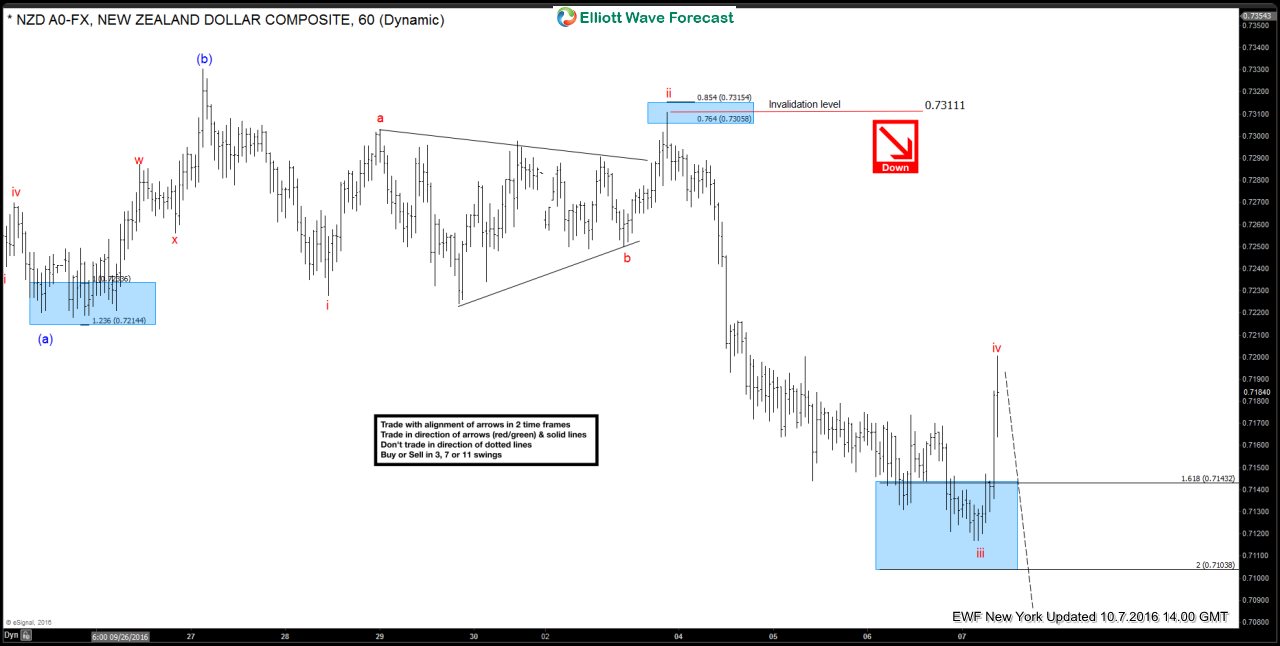 $NZDUSD NY Update 10.12.2016 The price is in the important technical area : 0.71169-0.7020 , expected to bounce in 3 waves at least.
Keep in mind that market is dynamic and the view could change in mean time. If you’re interested in the future path of $NZDUSD, you can find a new Elliott Wave analysis in the membership area of EWF. ( If not a member yet, all you have to do is to Sign Up for Free 14 Days Trial )
Success in trading requires proper risk/money management, so does understanding of Elliott Wave theory, Cycle and Correlation analysis.
Through time we have developed a very respectable trading strategy which defines Entry, Stop Loss and Take Profit levels with high accuracy and allows you to make position Risk Free, shortly after taking it, protecting your account. If you want to learn all about it and become a professional Trader, sign up now and get 14 DAYS FREE TRIAL .
You will get access to Professional Elliott Wave analysis in 4 different time frames, Strategy of the Day/Week Video, Live Trading Room, 2 live Analysis Session done by our Expert Analysts every day, 24 Hour Chat Room support, Market Overview, Weekly technical videos and much more…
Welcome to Elliott Wave Forecast!
Back