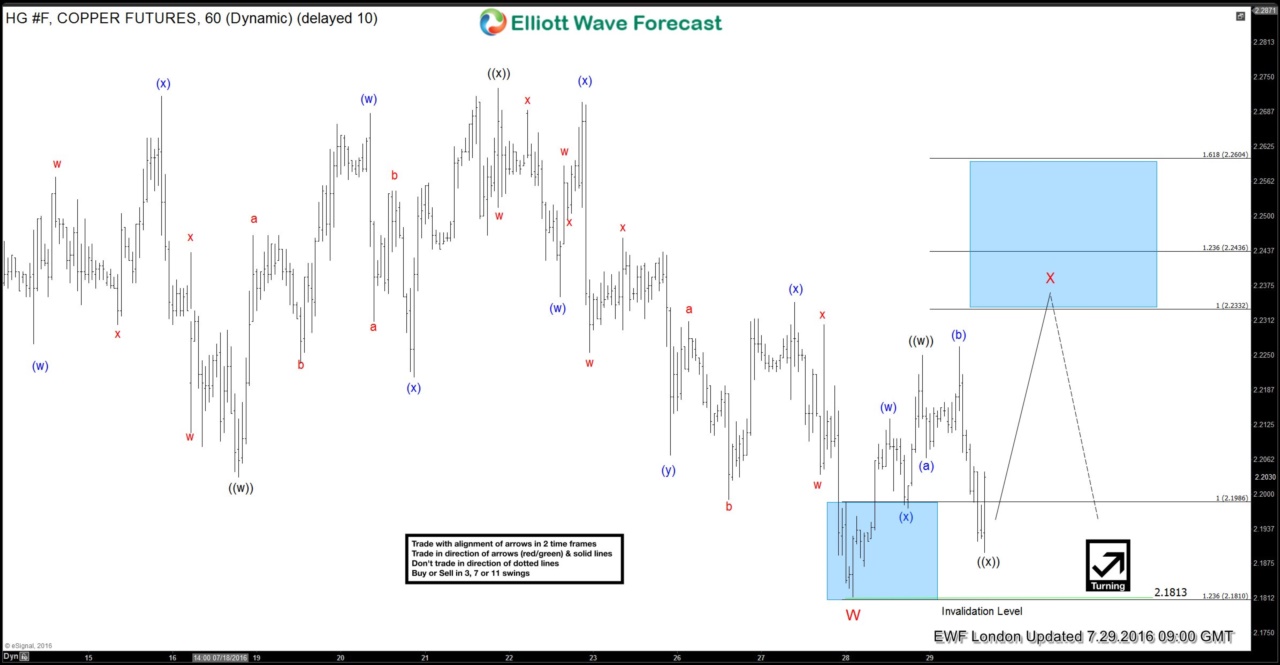
During the last days of July 2016 Copper Futures has been forming very interesting price patterns. Our Elliott Wave and Cycle analysis suggested the price has been correcting the decline from the 07/12 peak, looking for 2.233-2.260 area where sellers would be appear. Copper was proposed to reach the mentioned area and complete wave X red recovery there before the decline resumes in another leg lower. Wave Y red was expected to break below 07/27 low ( 2.1813).
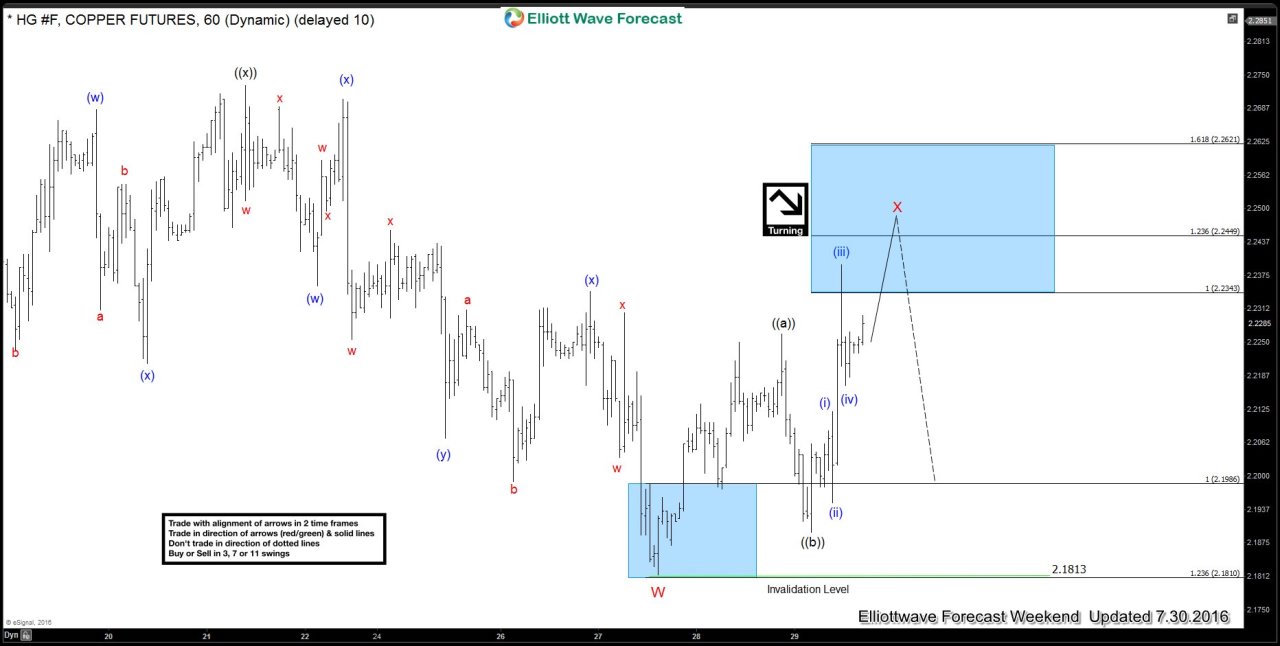
Next picture is $Copper 60min 07/30 Weeken Update. The price has reached important technical area at 2.2343-1.2449 and we could counted wave X red already completed ,however as the leg from the 2.195 low looked too extended, we supposed that mentioned rally was only wave (iii) blue of ((c)) of X red which has taken the form of Flat pattern. Another marginal push up was expected in wave (v) of ((c)) as the chart below is showing.
If you want to learn more about Flat pattern, check out our previous educational blogs.
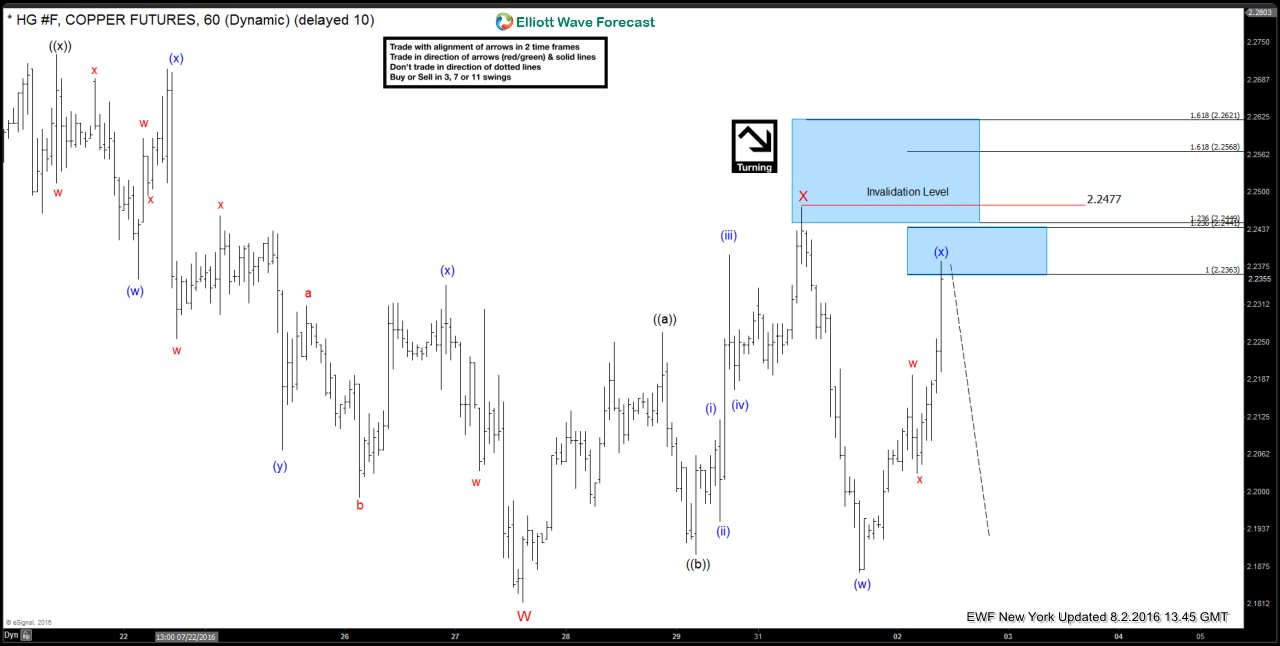
$Copper h1 NY Update 8.2.2016 We got another high as expected and the price completed wave X red at the 2.2477 level. Copper gave us very nice reaction from there,but sellers haven’t been strong enough to break the important low from 07/27 date (2.1813) and we got deep bounce again against the 2.247 high. The price made double wxy and reached technical area at 2.2363-2.2441. Although it was close to the previous high: 2.2477, at that time nothing has suggested that price is going to break it, and we were calling further decline from the mentioned tech area.
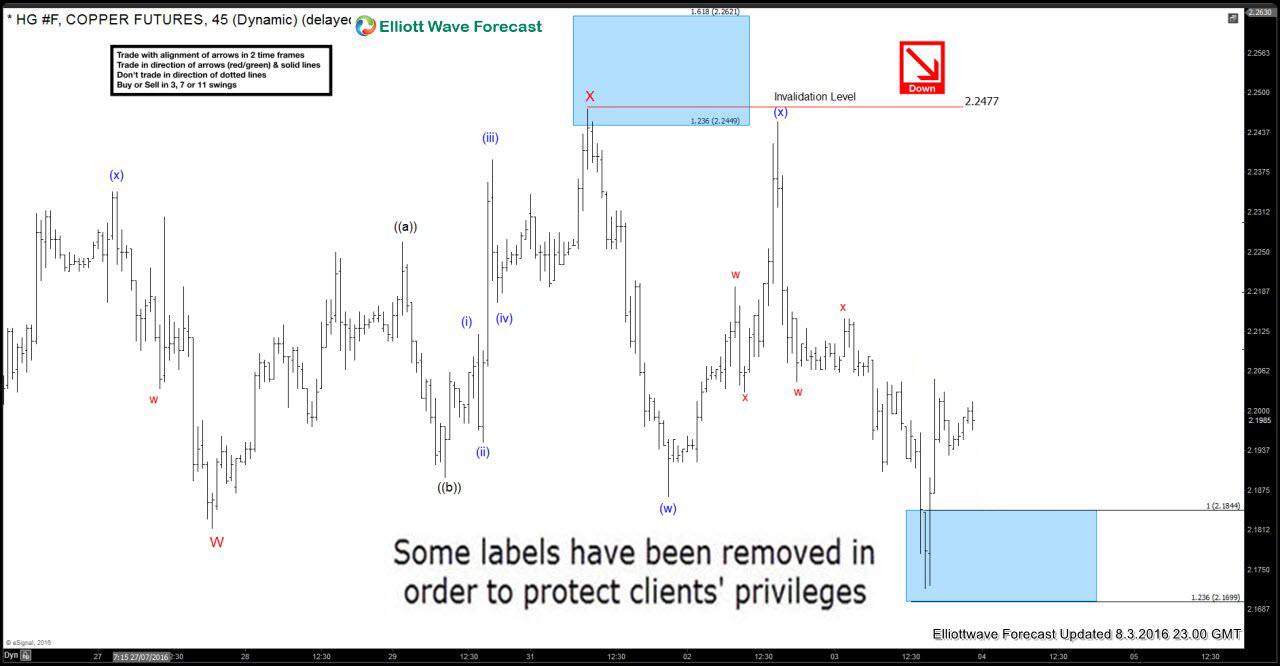
$Copper H1Update 8.3.2016 On 3th August, Copper finaly broke the 2.1813 low.
We removed some labeling in orrder to protect clients’ privleges. Update charts and expected future path of $HG #F can be found in the membership area of EWF. ( If not a member yet just sign up for 14 days Free Trial)
Proper Elliott Wave counting is crucial in order to be a successful trader. If you want to learn more on how to implement Elliott Wave Theory in your trading and to learn more about next trading opportunities in the Market, try us free for 14 days. You will get access to Professional Elliott Wave analysis in 4 different time frames, Strategy of the Day/Week Video ,Live Trading Room , 2 live Analysis Session done by our Expert Analysts every day, 24 Hour Chat Room support, Market Overview, Weekly technical videos and much more…
Welcome to Elliott Wave Forecast !
Back


