The Bank of Japan on Last Friday disappointed investors by offering a round much lower than expected extra while announcing a review of its current policy measures stimulus, leading some observers to wonder whether politicians fear that they are running out of tools to revive the Japanese economy. The Bank of Japan under the governor, Haruhiko Kuroda has been aggressive buyers of bonds and stocks. His decision to apply negative rates earlier this year, investors caught off guard, but the measure was considered counterproductive as the Japanese yen failed to weaken.
The Bank of Japan doubled its annual target fund buying Japanese stock traded at $ 57 billion, but disappointed not to expand its bond-buying program. And the decision to leave its benchmark rate unchanged at 0.1% less than was especially disappointing, bringing the highest yields in the short end of the yield curve of Japanese government bonds. Kuroda, in an interview with the BBC issued in July, had tried to stay away from investors the possibility that the helicopter money. USDJPY Japanese yen, strengthening + 0.08% following the decision, with the pair $USDJPY temporarily dip below ¥ 103. In general, investors took it easy, however, with the Nikkei NIK, -0.93% from an initial drop to finish 0.6% higher. The lack of quantitative easing did boost the yen $USDJPY -1.55%, with the currency rising by as much as 2.5% against the U.S. dollar Friday in Asia trade and gaining 2.9% for the week.
How we anticipated the move ahead of Bank of Japan?
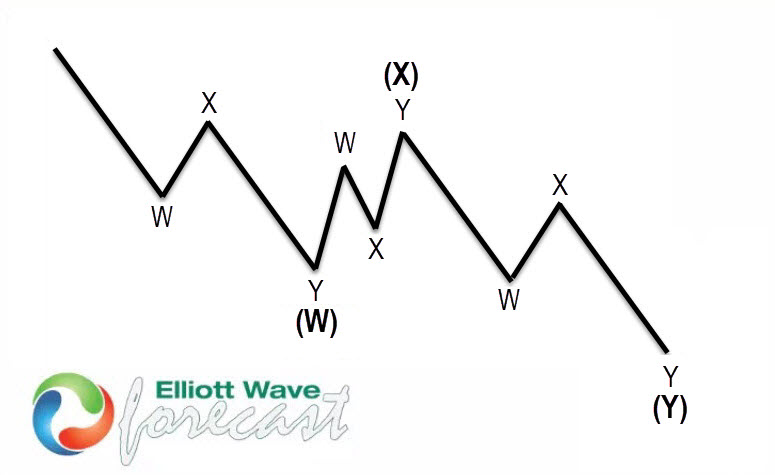
One of the most common patterns in New Elliott Wave theory is 7 swings structure (double three). We spot it in the market every day in many instruments. It’s a very reliable structure by which we can make good analysis and what is most important it’s giving us good trading entries with clearly defined invalidation levels and target areas. The picture below presents what Elliott Wave Double Three pattern looks like. It has (W),(X),(Y) labeling and 3,3,3 inner structure, which means all of these 3 legs are corrective sequences. Each (W) and (Y) are made of 3 swings, they’re having W,X,Y structure in lower degree.
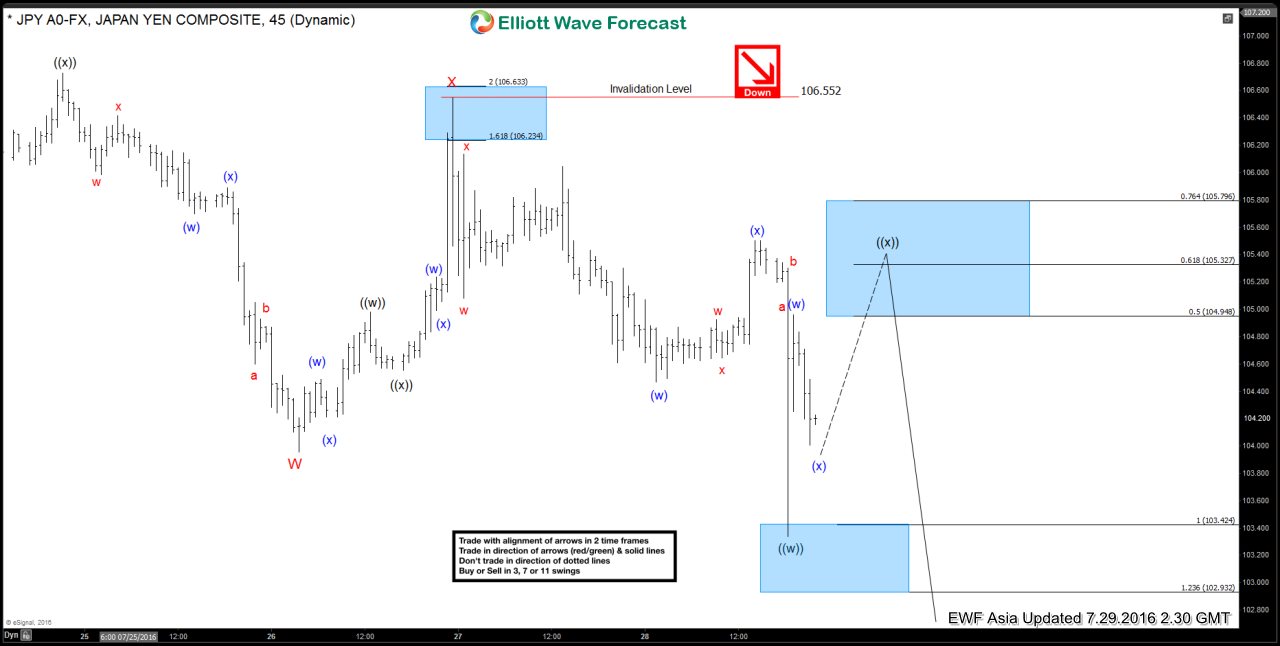
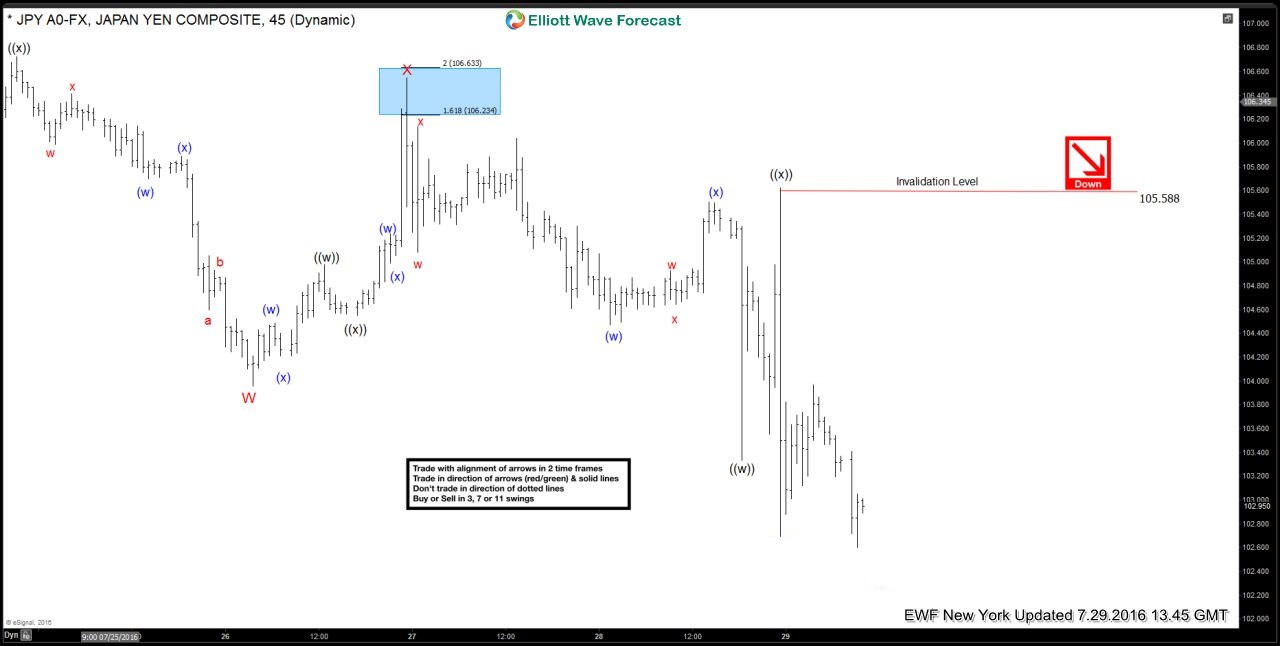
The Charts from 7/29 Asia updated is suggesting 3 swings down from the 7/21 peak (107.49) is labeled as ((w))-((x))-((y)) within wave W in red ended at 103.98 low & then pair ended the bounce in 3 swings labelled as ((w))-((x))-((y)) within X at 106.55. We can see that before BOJ announcement hit the wires, pair had broken below 103.98 (red W) low and was showing 5 swings down from 7/21 peak @ 107.49. We know 5 swings is an incomplete sequence and unless pair turned into a FLAT from 103.98 low, the next bounce should turn out to be an ((x)) wave and fail below 106.55 high for another push to the downside. After BOJ news hit the wires, pair made a push higher as shown on the chart to offer a short-term selling opportunity against 106.55 high and then made new lows to complete a 7 swing sequence down from 7.21.2016 peak.
Proper Elliott Wave counting is crucial in order to be a successful trader. If you want to learn more on how to implement Elliott Wave Theory in your trading and to learn more about next trading opportunities in the Market, try us free for 14 days. You will get access to Professional Elliott Wave analysis in 4 different time frames, Daily Elliott Wave Setup Videos ,Live Trading Room and 2 live Analysis Session done by our Expert Analysts every day, 24 hour chat room support, market overview, weekly technical videos and much more. If you are not member yet, use this opportunity and sign up now to get your (free trial).
Back


