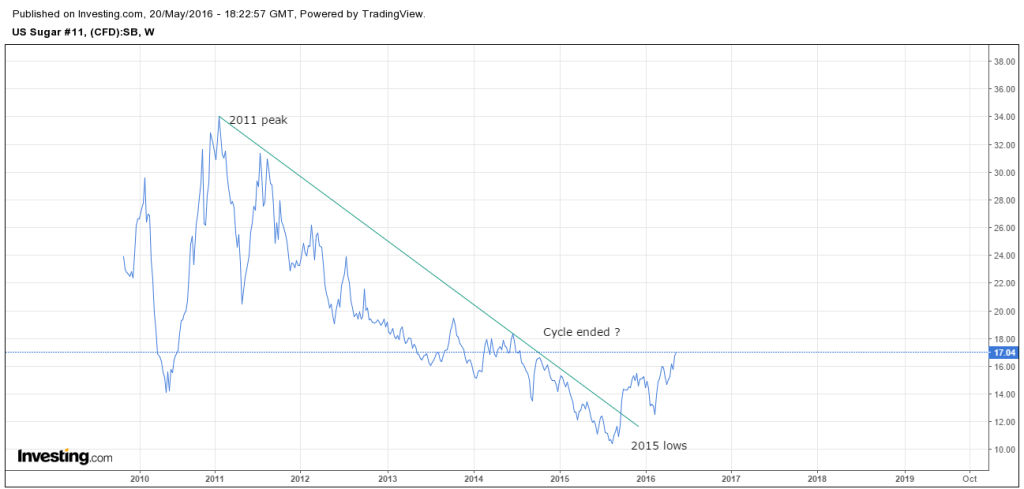
Global consumption for 2016/17 is forecast at a record 174 million metric tons (raw value), exceeding production and drawing stocks down to the lowest level since 2010/11. Production is up 4 million tons to 169 million as gains in Brazil and the European Union more than offset a decline in India. With growing demand, imports are forecast up 1.2 million tons. The rising pace of global consumption has been sustained by drawing down stock levels in recent years. Consequently, stocks are approaching what appear to be historically low levels. In fact, world raw sugar prices, after falling for over a year and bottoming at less than 11 cents per pound in August 2015, are trending higher to near 17 cents in May 2016. As prices react to high demand and as the Brazilian real struggles to find equilibrium against the dollar, market returns are needed to provide incentives for producers to catch up with demand.
The International Sugar Organization (ISO), assuming average growth in global Sugar demand, forecasts a looming world production deficit of more than 6 million tones over the next two seasons. It also forecasts a 2.3 million tones shortfall in 2015-2016. This is the first shortfall in six years. Sugar, driven more by the invisible hand following deflationary forces than the ISO forecasts, has been mired in a bear market despite production deficits since 2011. Given that Chart above is showing the drawdown of Production & Rising demand of consumption given that is it the right time for prices to rebound?? Well let’s take a look at the weekly chart where price is trading outside the channel for first time since 2011.
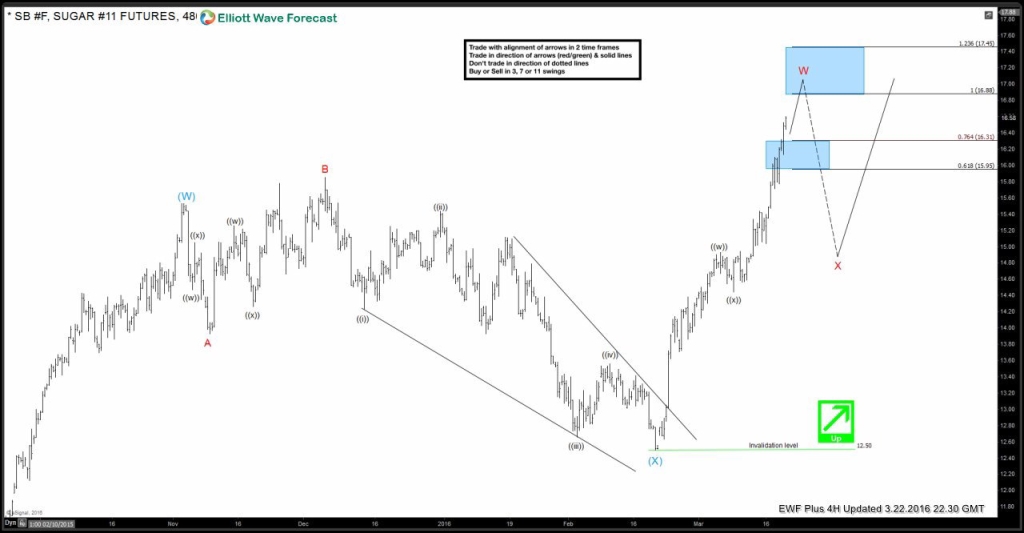
Now lets take a look at our Elliott wave forecast which we presented to our Clients, which is based on the Distribution & Market correlations system. Below is the chart of March the 22nd, which is calling for a pullback in wave X in red from blue box area before continued strength higher.
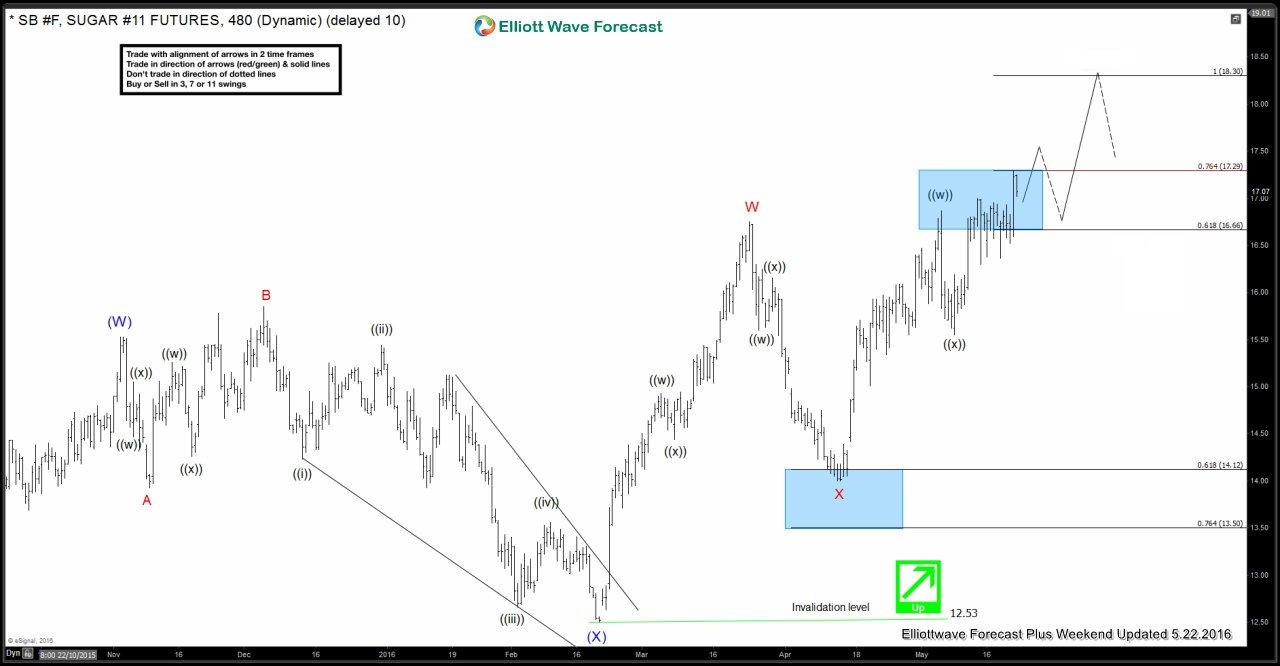
Since then Market did a pullback nicely from above mentioned blue box area and reached the buying areas within wave X in red pullback and then turned higher again to make new highs. Let’s take a look at the recent 4 hour chart of Sugar.
For further information on how to find levels to trade Sugar, Wheat, Copper or other commodities, indices, metals and forex using Elliottwave, take our FREE 14 Day Trial . We provide Elliott Wave chart in 4 different time frames, up to 4 times a day update in 1 hour chart, two live sessions by our expert analysts, 24 hour chat room moderated by our expert analysts, market overview, and much more! With our expert team at your side to provide you with all the timely and accurate analysis, you will never be left in the dark and you can concentrate more on the actual trading and making profits.
Back


