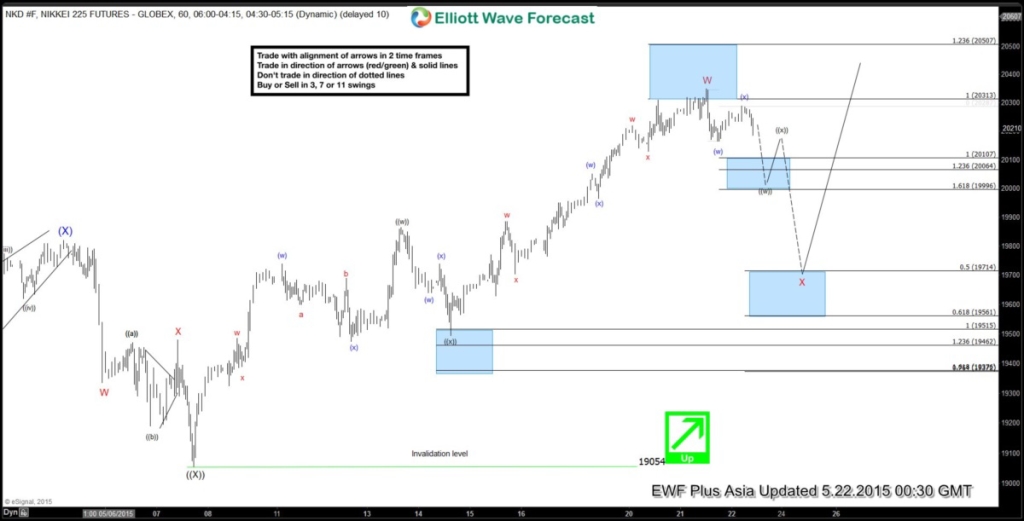
Decline to 19054 completed wave ((X)), and the Index has since resumed the rally in wave W in the form of a double correction ((w))-((x))-((y)) where wave ((w)) ended at 19865 and wave ((x)) ended at 19495. In our previous Nikkei 225 Chart of the Day posted at 5.20.2015, we said wave ((y)) is in progress towards 20314 – 20507, and some profit taking should be seen from 20314 – 20507 area and the Index to pullback 3 waves lower in wave X to correct the rally from 19054.
Since our last update, current preferred Elliottwave view suggests wave ((y)) of W has ended at 20350, and wave X pullback is in progress towards the ideal target of 19561 – 19714 (50 – 61.8 back). Wave X pullback is unfolding in the form of a double correction ((w))-((x))-((y)) where wave ((w)) is expected to complete at 19996 – 20107, then it should bounce in wave ((x)) before turning lower to resume wave X pullback towards 19561 – 19714. We do not like selling the proposed wave X pullback. As far as 19054 pivot holds in wave X pullback, expect buyers to come for 3 waves higher at minimum to correct the decline from 20350 per Elliott Wave hedging technique.
At EWF we offer 24 hour coverage of 41 instruments from Monday – Friday using Elliott Wave Theory as primary tools of analysis. We provide Elliott Wave chart in 4 different time frames, up to 4 times a day update in 1 hour chart, two live sessions by our expert analysts, 24 hour chat room moderated by our expert analysts, market overview, and much more! With our expert team at your side to provide you with all the timely and accurate analysis, you will never be left in the dark and you can concentrate more on the actual trading and making profits. Click for Free 14 day Trial
Back


