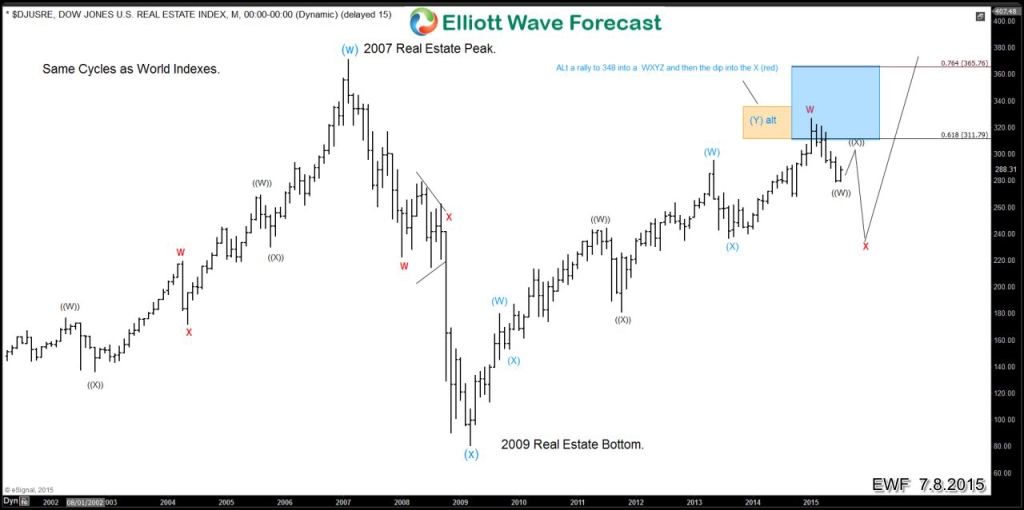
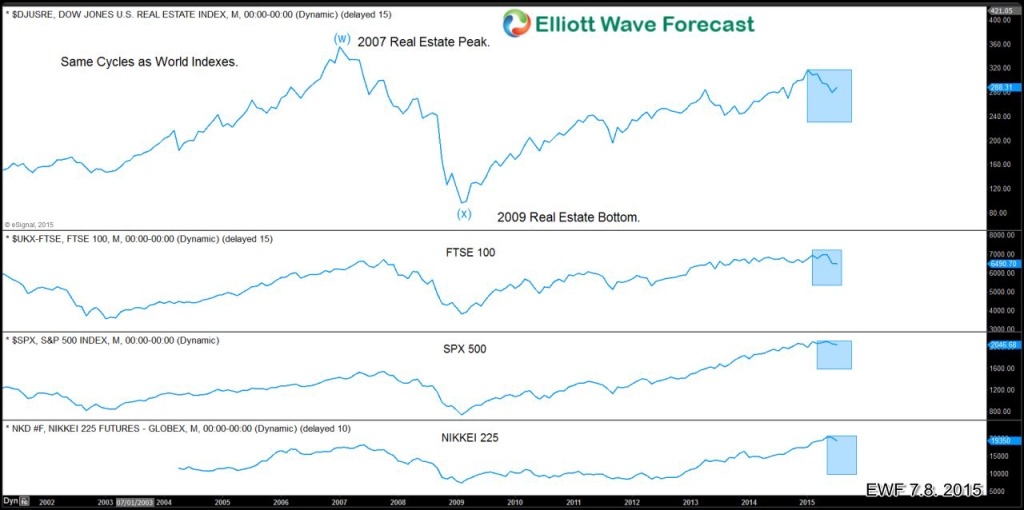
Today, we are going to revisit Elliott Wave Analysis of the Real Estate sector and see how it’s been performing in comparison with rest of the World Indices. We can hardly spot any differences as we think Real Estate sector is following the same cycles as Dow & SPX. There was a Real estate peak in 2007 that we have labelled as (w). It was the time when every one was very enthusiastic about investing in the real estate market for the fear of getting left out of the move. However, no one paid attention to the fact that market was in a technical area from where a decent pull back could take place. It was the 123.6 – 161.8 ext of ((W))-((X)) starting from red x low (May 2004). Real Estate did turn lower as the Elliott Wave analysis would have suggested, it was a steep decline but once again buyers appeared where they should have appeared. Just around 123.6 ext of red w-x. Index then started a rally creating a Real Estate bottom in 2009 (to be confirmed on a break above 2007 peak).
Seeing the Global Indexes and where they stand at this moment, it is possible that the Real Estate Index already is entering a correction in red x and prices should dip to around 2012 levels, which can be another chance to buy Real Estate. The Price is turning lower from the blue BOX which is the 61.8-76.4 area of the Peak and bottom extension, in the most bullish view, it could still do another extension to 342 area before the pull back. A bit of patience is needed but good investments in Real Estate should happen soon before we head to all time highs. We think it’s highly unlikely that we would see 2009 prices again. The Math won’t allow that .
We do Elliott Wave Analysis of 42 instruments in 4 time frames (Weekly, Daily, 4 Hour and 1 Hour) with 1 hour charts updated 4 times a day so clients are always in loop for the next move. Please feel free to come visit around the website and click Here to Start your 14 day Trial (No commitments, Cancel Anytime).
Back

