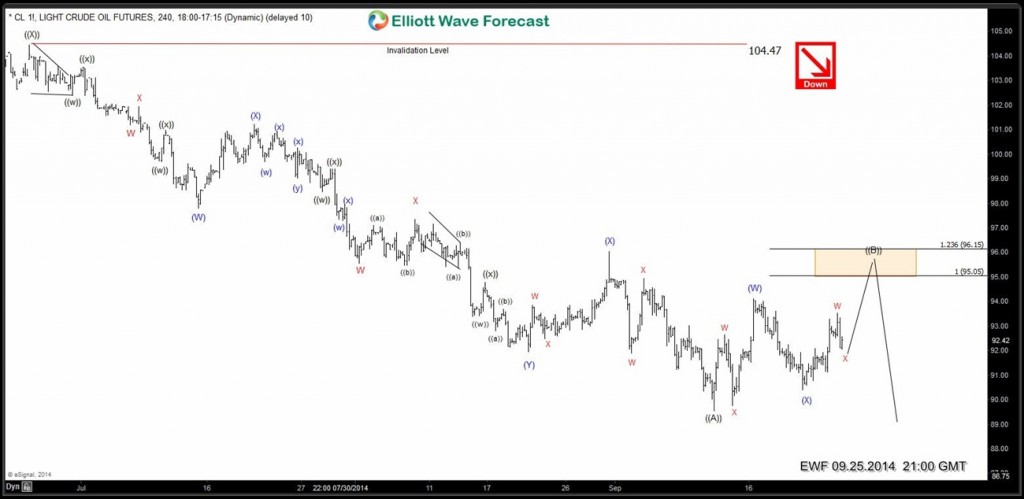
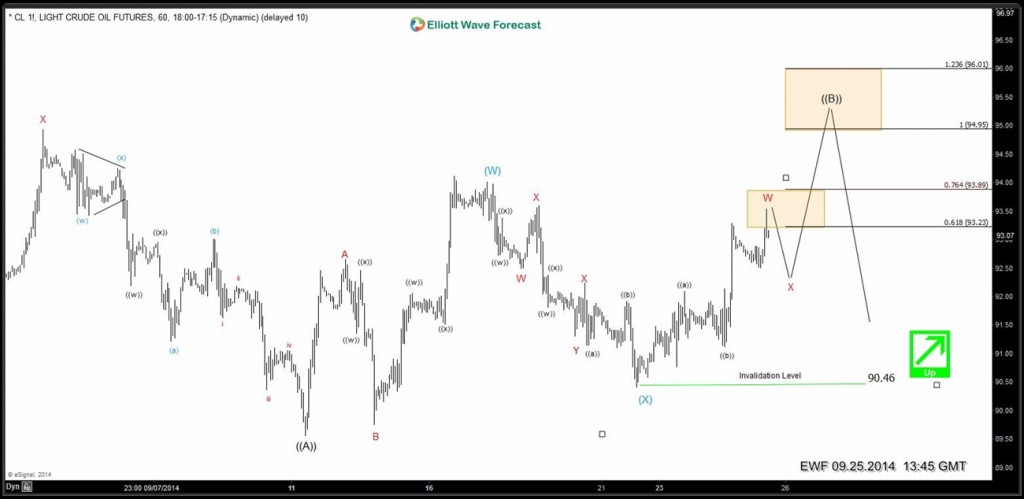
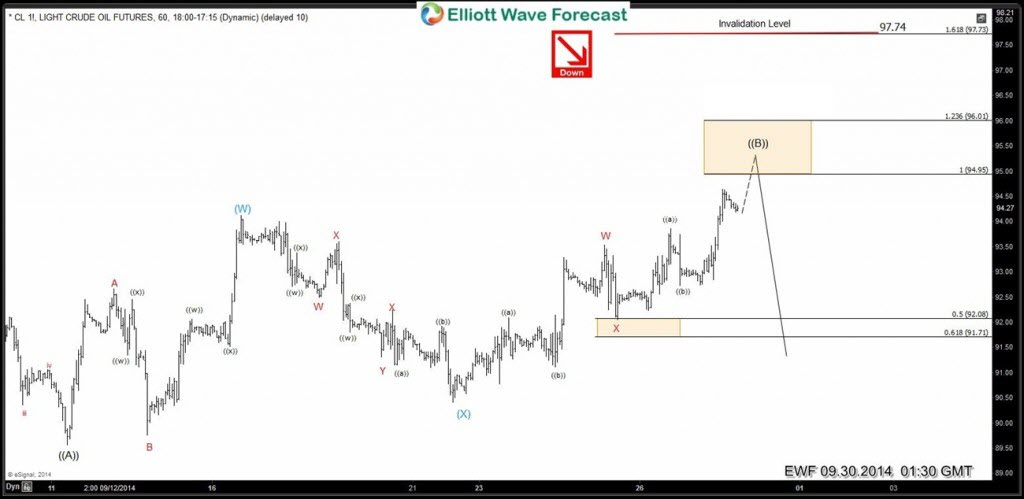
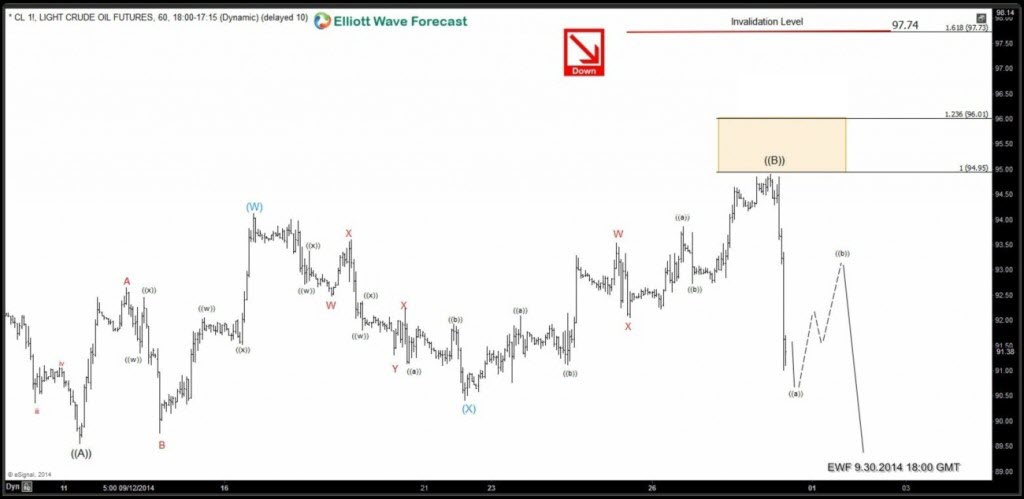
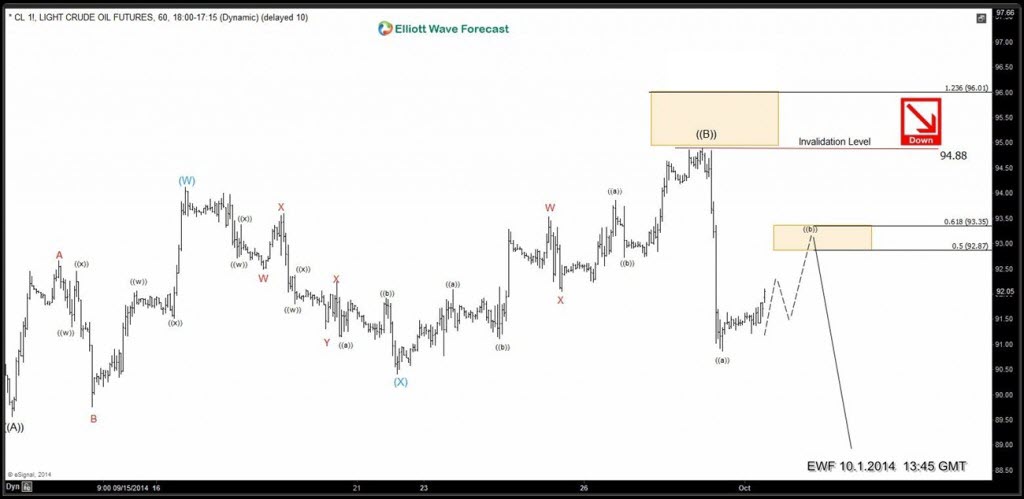
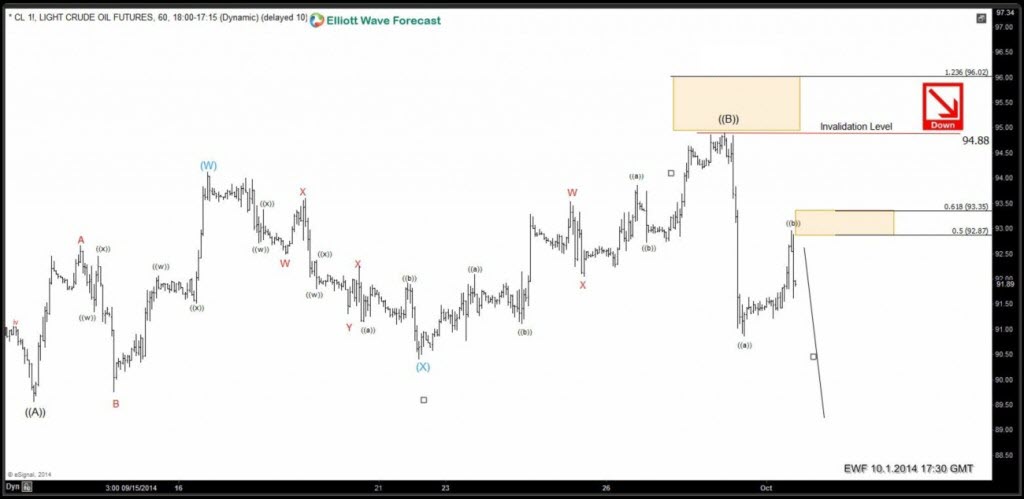
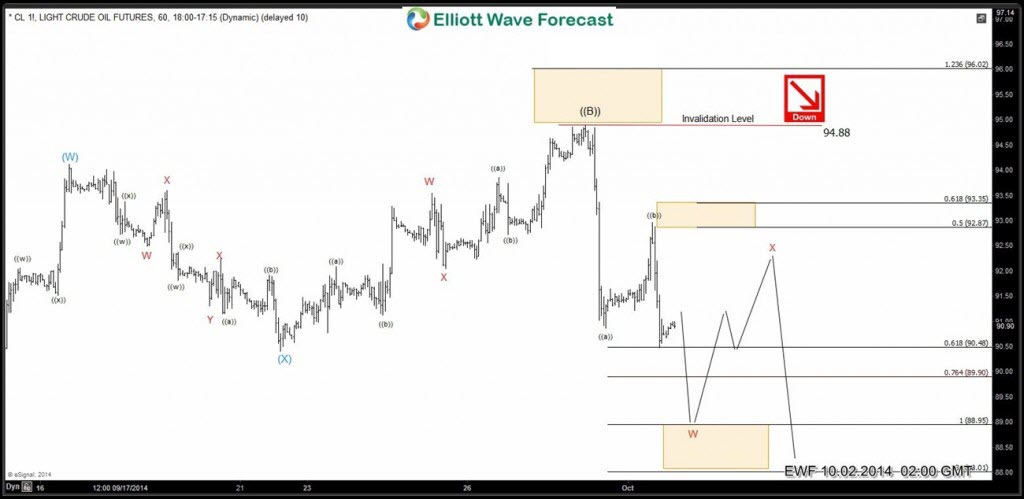
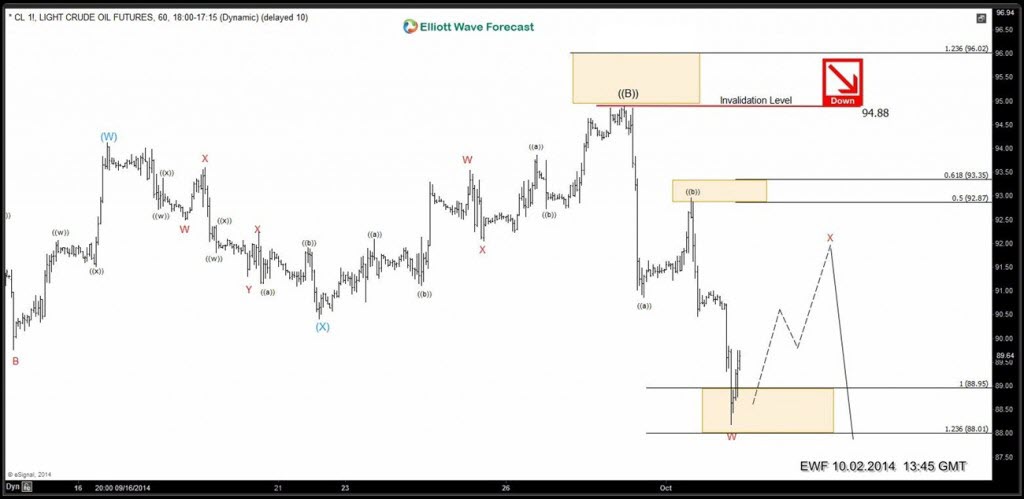
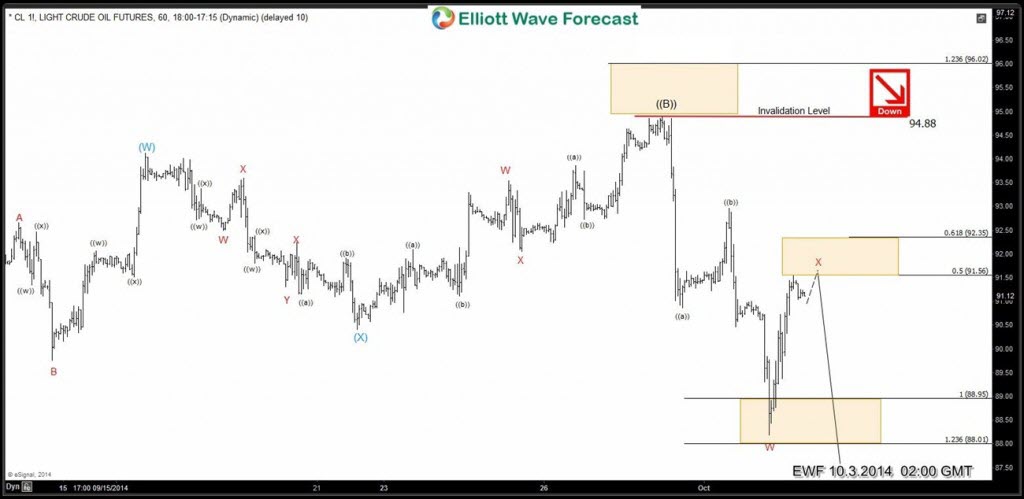
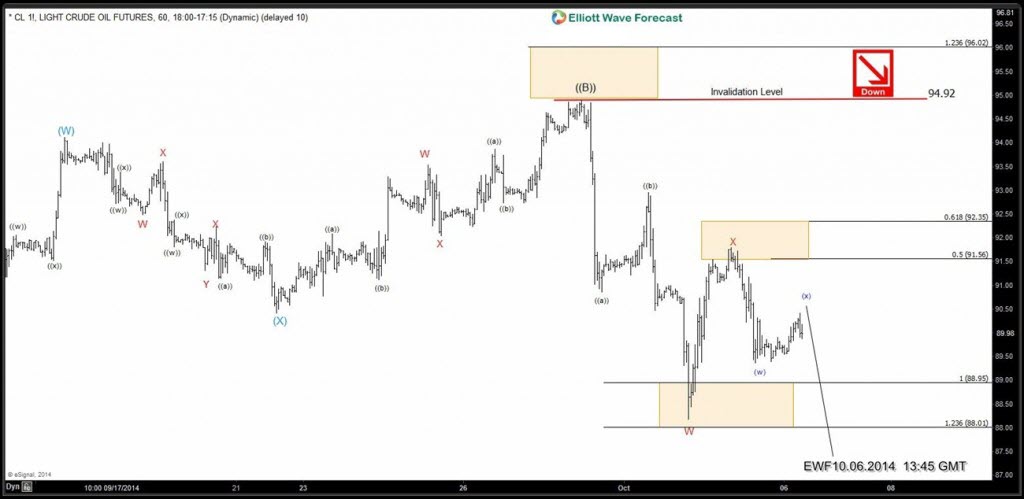
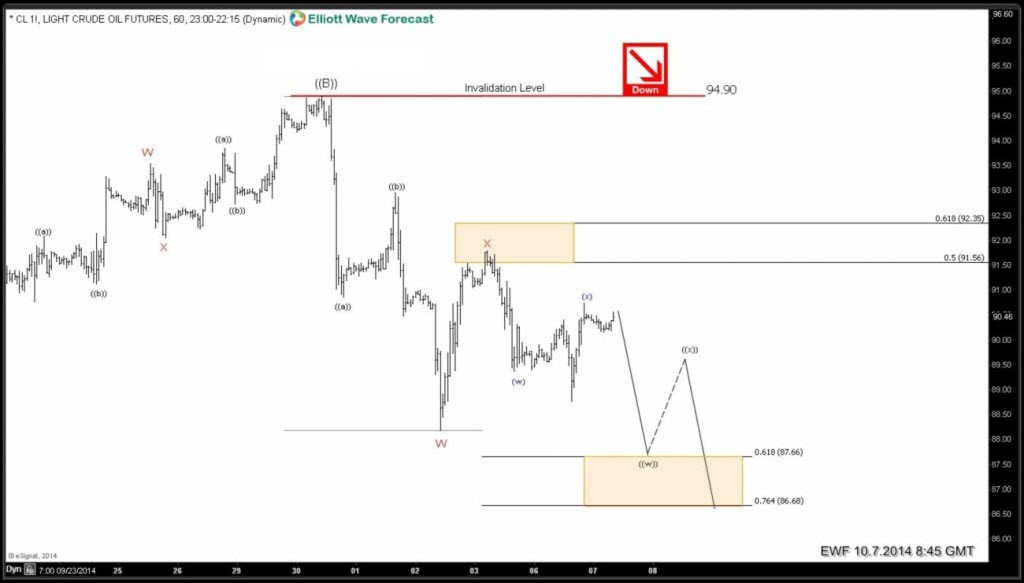
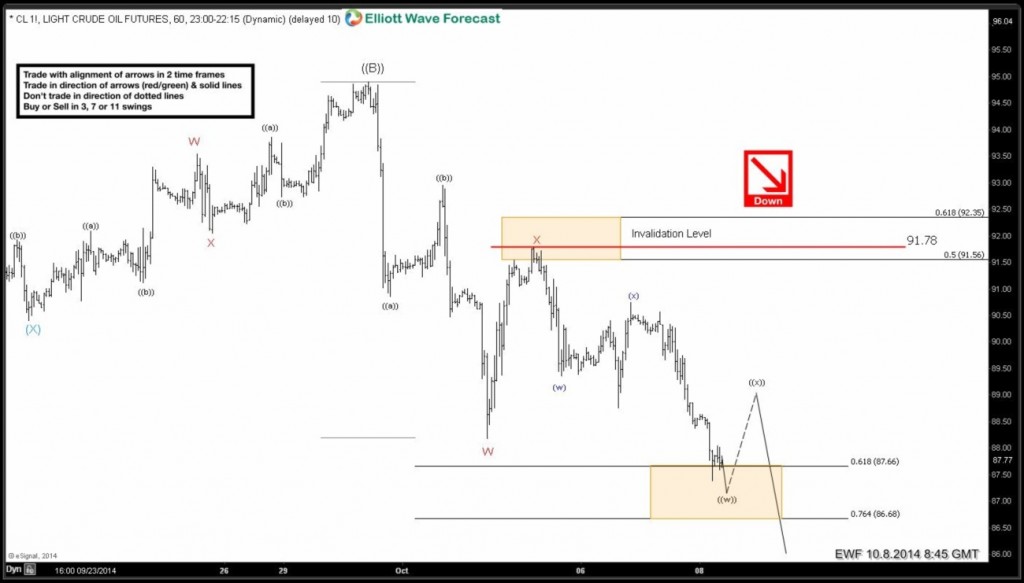
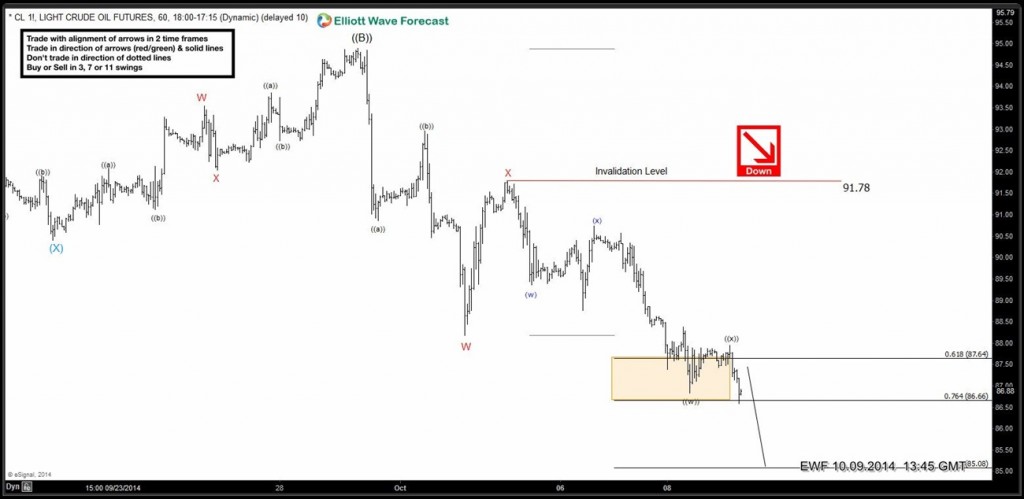
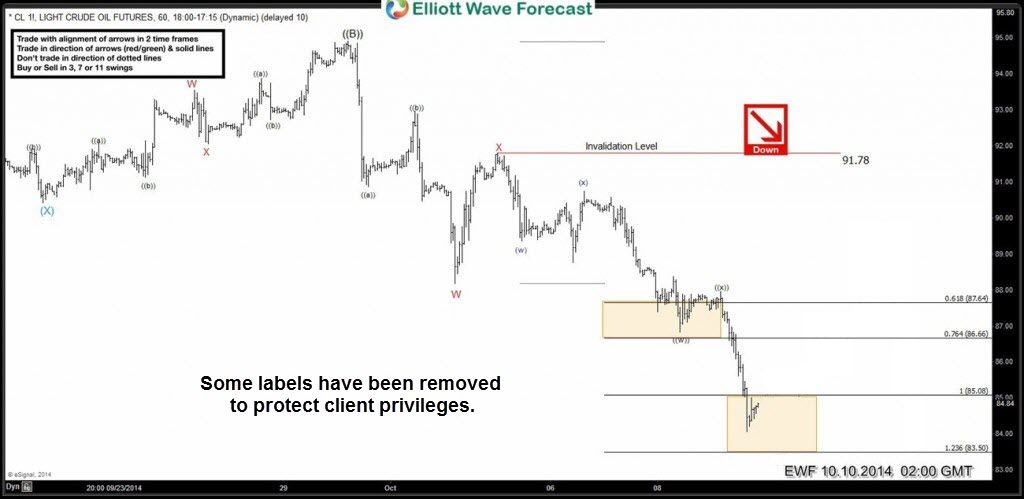
At the last days of September our Elliott Wave analysis for OIL suggested that we were doing double three corrective structure from the 89.56 low. The analysis was calling for more strength toward equal legs area (95.05-96.15) to complete wave ((B)) recovery, before further decline takes place in next bearish cycle – wave ((C)).
Let’s take a look at H1 Elliott Wave charts from the 25. September 2014. to see how we were guiding our members through the OIL price structure.
Note: Some labels have been removed to protect client privileges.
OIL September 25/2014 (NY Update)
OIL September 30/2014 (Asia Update)
OIL September 30/2014 (Mid- day NY Update)
OIL October 1/2014 (NY Update)
OIL October 1/2014 (Mid-day NY Update)
OIL October 2/2014 (Asia Update)
OIL October 2/2014 (NY Update)
OIL October 3/2014 (Asia Update)
OIL October 6/2014 (NY Update)
OIL October 7/2014 (London Update)
OIL October 8/2014 (London Update)
OIL October 9/2014 (NY Update)
OIL October 10/2014 (Asia Update)
If you would like to have access of EWF analysis in real time, feel free to join us. Now You have an opportunity to sign up for 14 Days Trial here and get Full acces of Premium Plus Plan in 2 weeks. We provide Elliott Wave charts in 4 different time frames, 2 live webinars by our expert analysts every day, 24 hour chat room, market overview,daily and weekly technical videos and much more.
If you want to become a Successuful Trader & master Elliott Wave like a Pro, we advise you to attend every day EWF Live Analysis Session , you will learn a lot from our Market Experts. More about subsription plans you can find here . Welcome to EWF !
Back
