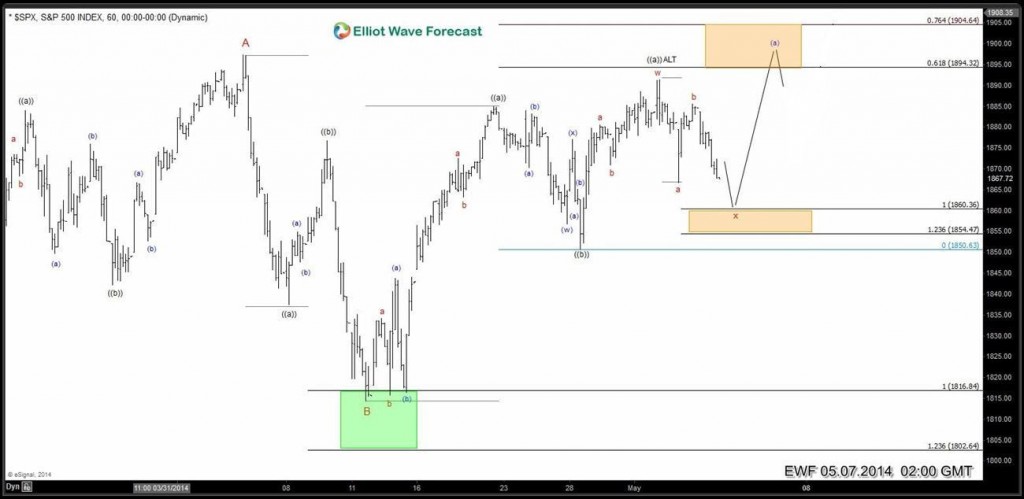
US Indices remain bullish and dips have been presenting buying opportunities. Let’s take a look at a recent buy setup in SPX and INDU. Using Elliott Wave Principle we knew that initial drop in SPX from 1891 – 1866 was in 3 waves, so we were expecting this high to break once the correction finished. Elliott Wave update on 5.7.2014 at 2:00 GMT forecasted a low to form between 1854 – 1860 area and rally to resume. Let’s take a look at some charts from members area to see what happened down there
SPX 1H May 7 2014 Asian Update
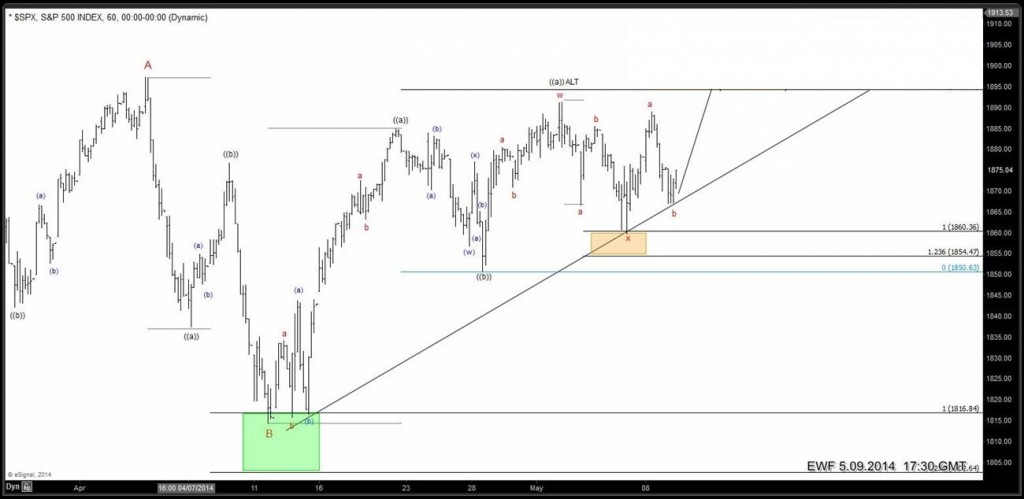
SPX 1H May 9 2014 Mid-day NY Update
It is very common for corrections to stop at c = a or c = 1.236 x a ext levels. SPX500 Index found buyers right at c = a target @ 1860 Extent of the bounce suggests corrective cycle from 1891 high is over, thus we expect the 1860 low to hold for continuation higher and are labelling the drop as wave “b” as per our preferred Elliott wave count.
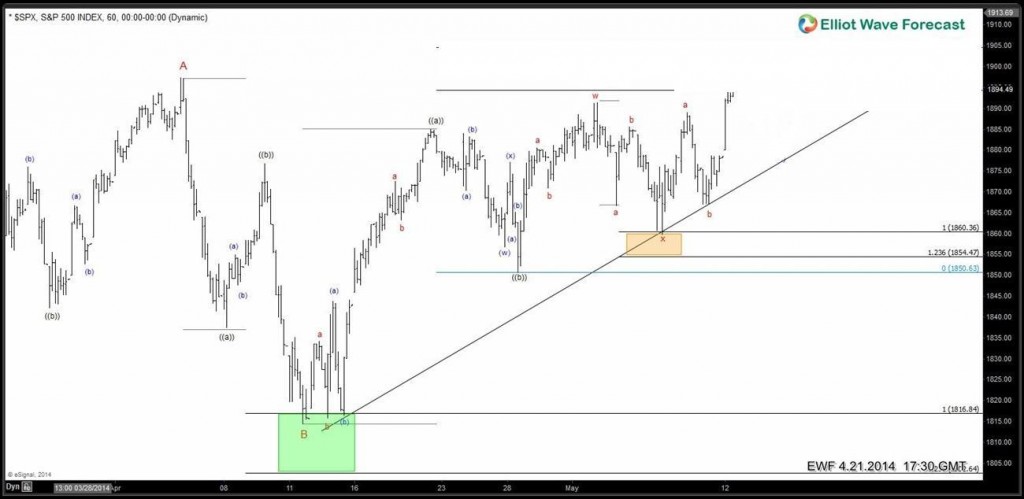
SPX 1H May 12 2014 Mid-day NY Update
SPX500 Index turned higher as expected and has already made a new high above 1891 peak.
We do Elliott Wave analysis of 26 instruments including Forex, Commodities, Indices and Bonds. Analysis is done in Weekly, Daily, 4 Hour and 1 Hour time frames. 1 Hour charts are updated 4 times a day so you are always in loop for the next move. Want to know where we think SPX is headed next? Sign up for 14 day Trial
Get *FREE London and Mid-day NY updates with Premium & Premium Plus plans (Expires 31 May 2014)
Back


