Zig-Zag or ABC is the most popular corrective pattern in Elliott Wave Theory. At the mention of the word “correction” many Elliott Wave practitioners would think of a Zig-Zag pattern and that’s one of the traps in modern analyzing . If you expect to see an ABC pattern in corrections every time, you’ll get more wrong than right.
The Evolution of Market Patterns
It’s important to understand that market is not the same as it was in 1930’s when Ralph Nelson Elliott developed the analytical tools which practitioners today call Elliott waves. Most of the long term EWF members already know that WXY (Double Three) pattern is more common than ABC ( Zig-Zag ) . That’s the reason why you don’t see ABC labeling as often as WXY at EWF charts.
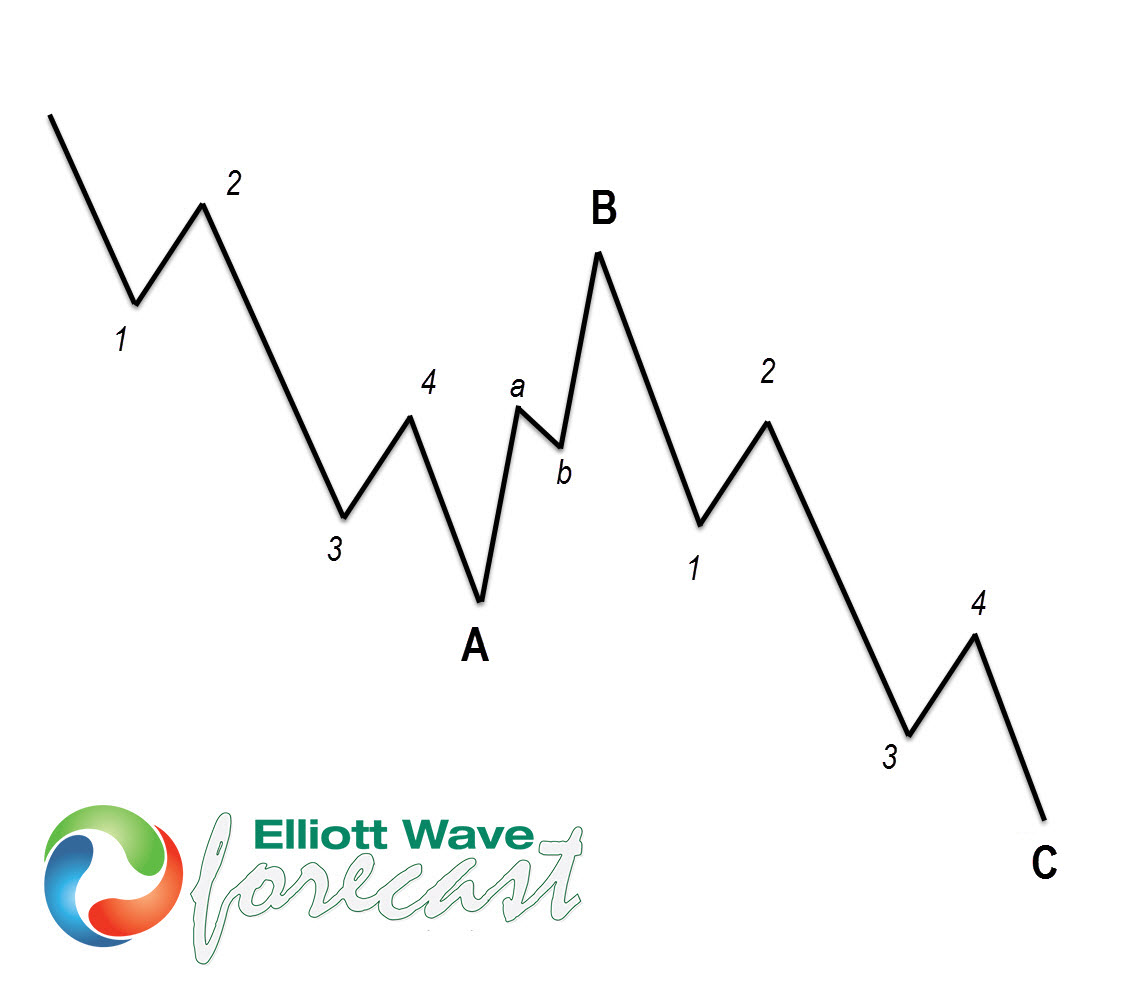
Elliott Wave Zig-Zag Pattern
Zig zag iz corrective Elliott Wave pattern made of 3 swings which have 5-3-5 inner structure. It’s labeled as A,B,C where A =5 waves, B=3 waves and C=5 waves. That means A and C are impulsive and they must meet all conditions of being 5 wave structure, such as: having RSI divergency between wave subdivisions, ideal Fibonacci extensions, retracements and so on… more on that topic could be find in Impulsive 5 wave structure – ground rules page.
Elliott Wave Double Three pattern:
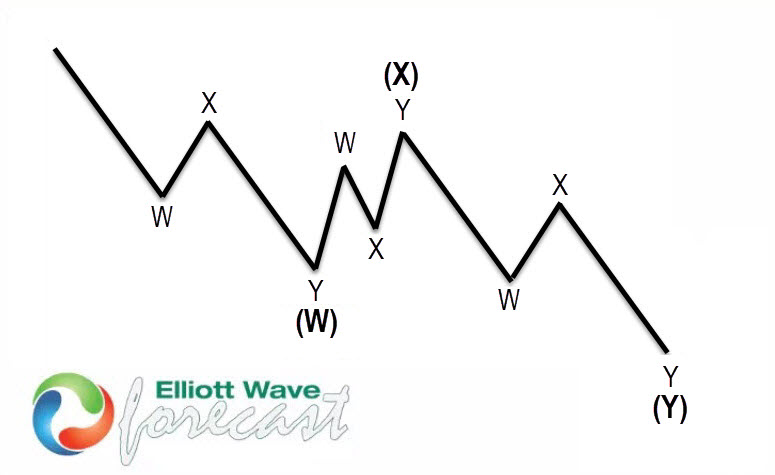
Double three or WXY is one of the most important patterns in New Elliott Wave theory and probably the most common corrective pattern in the market nowadays, also known as 7 swing structure. Wave subdivision is 3,3,3 which means all of these 3 waves are corrective sequences. In other words, each wave W, X or Y could have almost any corrective structures: double three, triple three, zigzag, flat, triangle, or any complex combinations. There are few exceptions that only one of them could be triangle and wave W can’t be a triangle structure.
The picture below presents what Elliott Wave Double Three pattern looks like. It has ((W)),((X)),((Y)) labeling and 3,3,3 inner structure, which means all of these 3 legs are corrective sequences. They’re also having W,W,Y structure in lower degree.

WXY Structure Elliott Wave Pattern
USD/JPY Example (July 7, 2015)
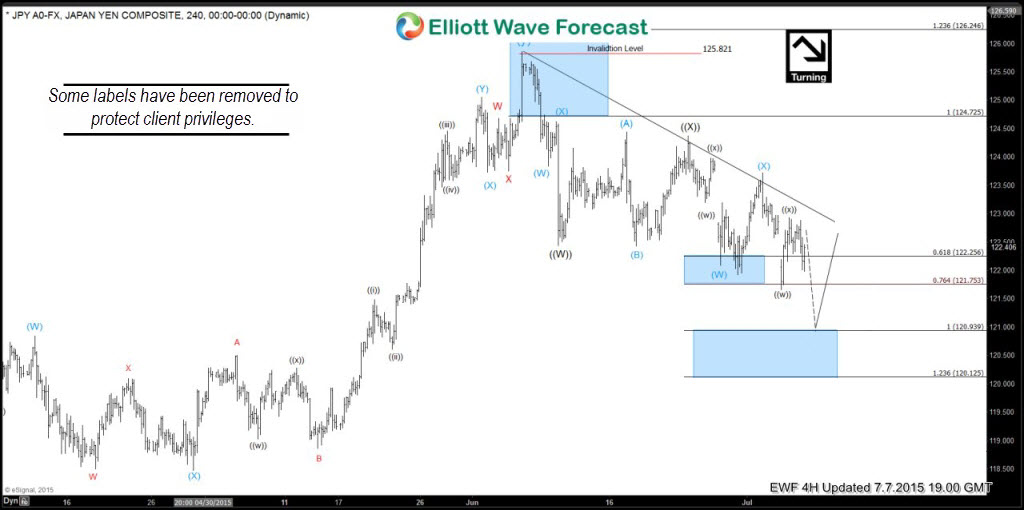
Nice example of this structure could be found in $USDJPY 7.7.2015 H4 Update.
As the chart is showing, we’re in ((W)), ((X)) , ((Y)) structure.
- ((W)) Wave is double three composed of blue (W), (X), (Y).
- ((X)) Wave recovery is (A),(B), (C) running flat structure.
- ((Y)) Wave is double three structure blue (W), (X), (Y).
Chart below shows another push lower toward 120.939-120.125 area should complete ((W))-((X))-((Y)) Elliott wave structure and give us a reaction higher at least in 3 waves from there.
Mastering Elliott Wave Analysis
Proper Elliott Wave counting is crucial in order to be a successful trader. If you want to learn more on how to implement Elliott Wave Theory in your trading, fell free to join us. You will get access to Professional Elliott Wave analysis in 4 different time frames,2 live webinars by our expert analysts every day, 24 hour chat room support, market overview, daily and weekly technical videos and much more…
Welcome to Elliott Wave Forecast !
Back


