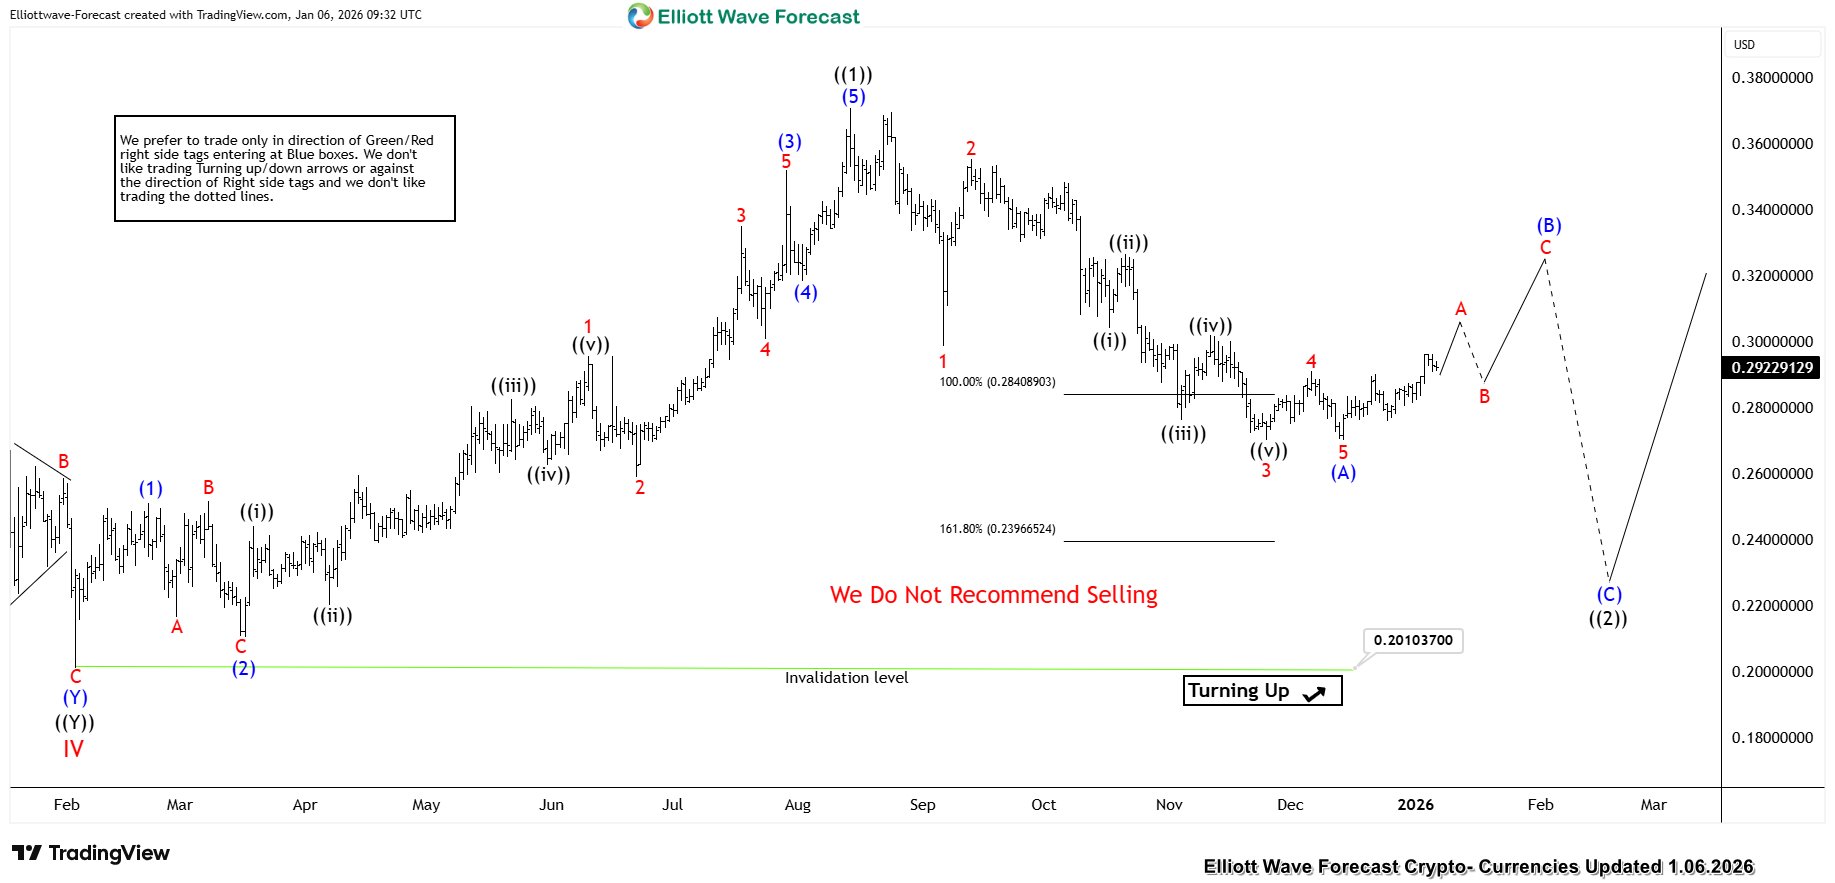
The near-term view is suggesting that the rally from all-time lows ended in wave ((I)) at $0.3505 high. Down from there, the bigger correction against the all-time low ended on March 2020 low at $0.0066 low within wave ((II)). Up from there, the pair rallied in a 5 waves impulse sequence & ended wave (I) at $0.1844 high. Then the pullback to $0.04456 low ended wave (II). Above from there, the rally to $0.1313 high ended wave I & made a pullback in wave II to correct the cycle from June 2021 low. The pullback then unfolded as a zigzag structure where wave ((A)) ended at $0.0509 low. Wave ((B)) ended at $0.09255 high & wave ((C)) ended at $0.04526 low thus completing the wave II pullback. Near-term, as far as dips remain above $0.2010 low and more importantly above $0.1048 low the pair is expected to resume higher or should do a bigger 3 wave bounce at least.
Tron TRXUSD Daily Elliott Wave Chart 1.06.2026

