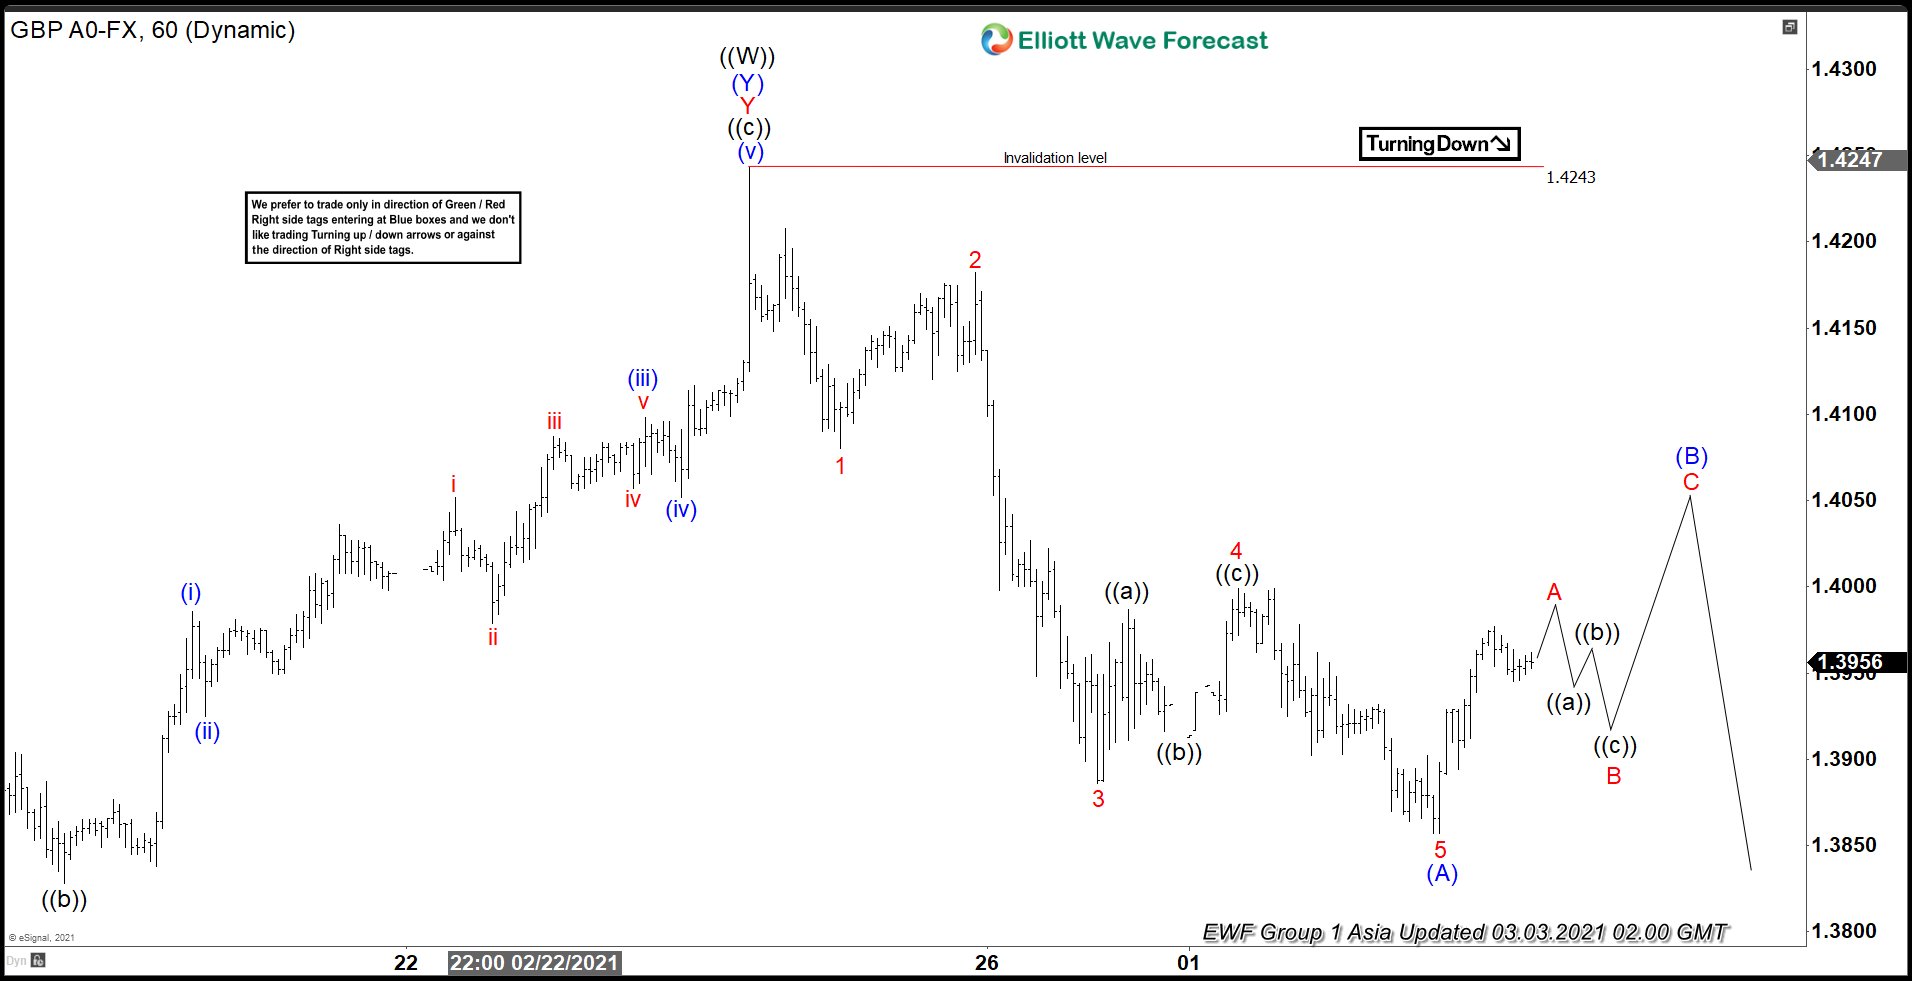
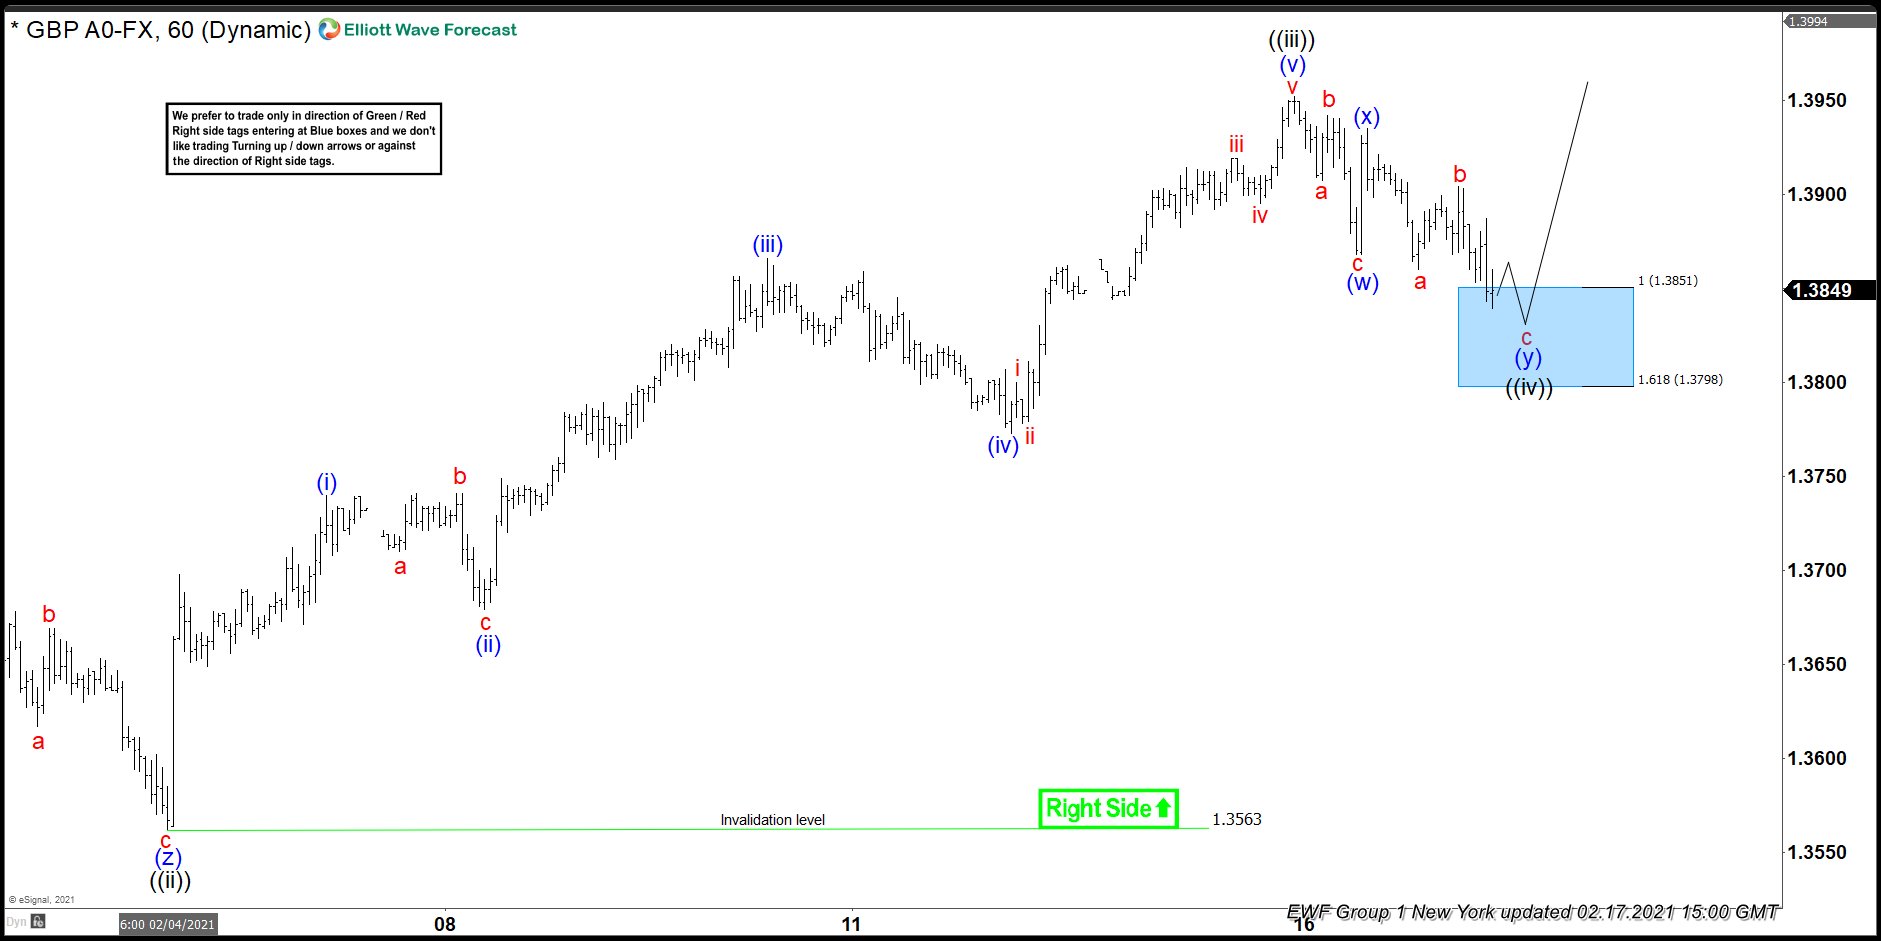
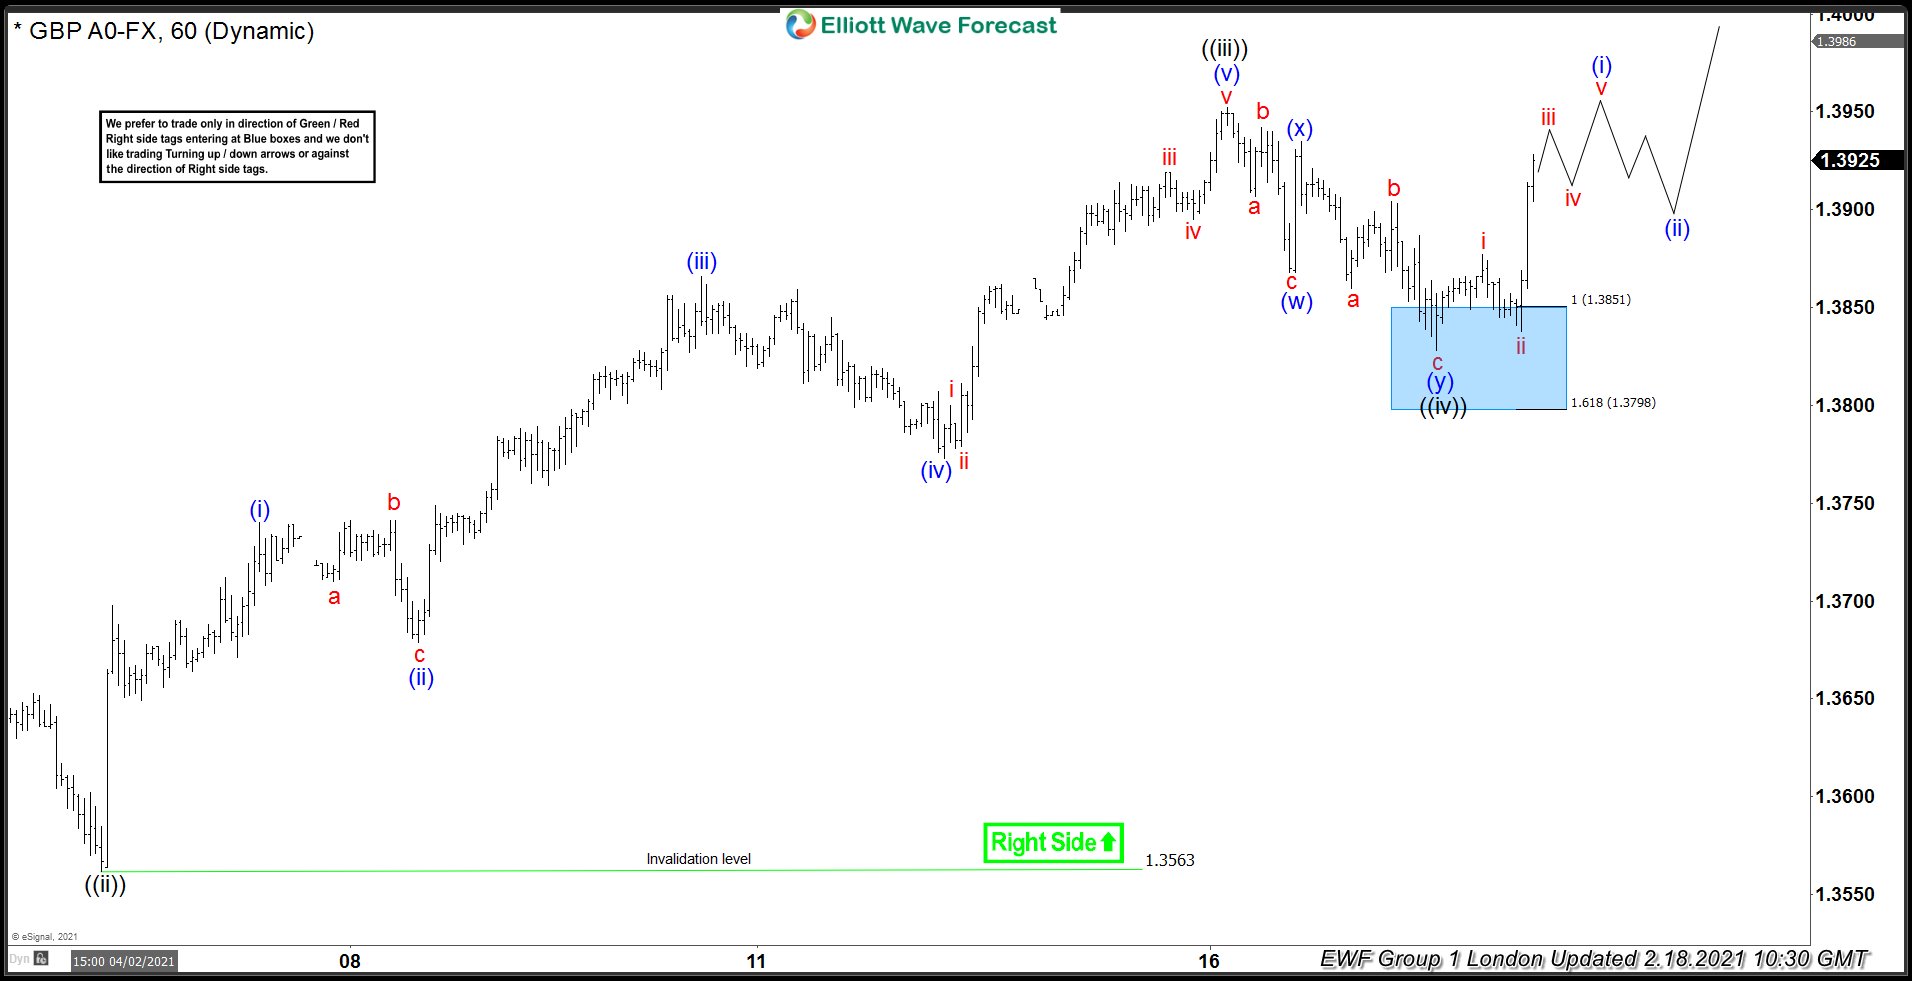
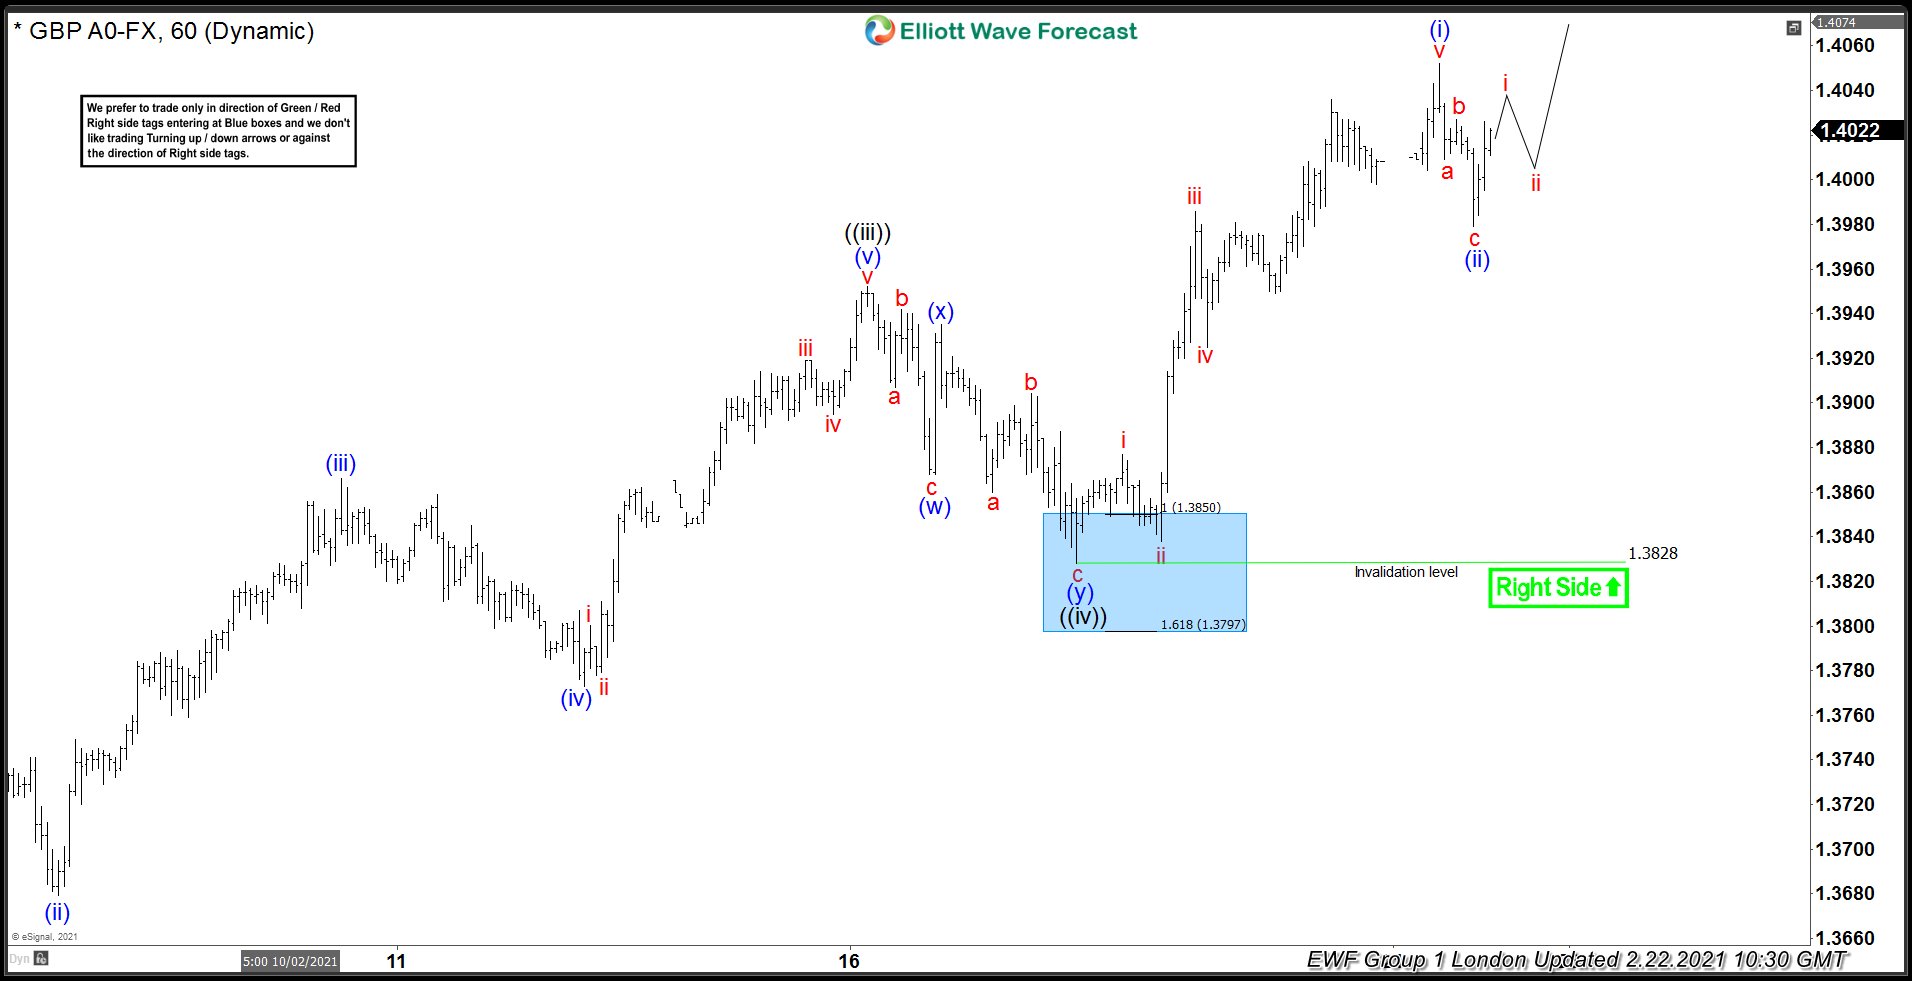
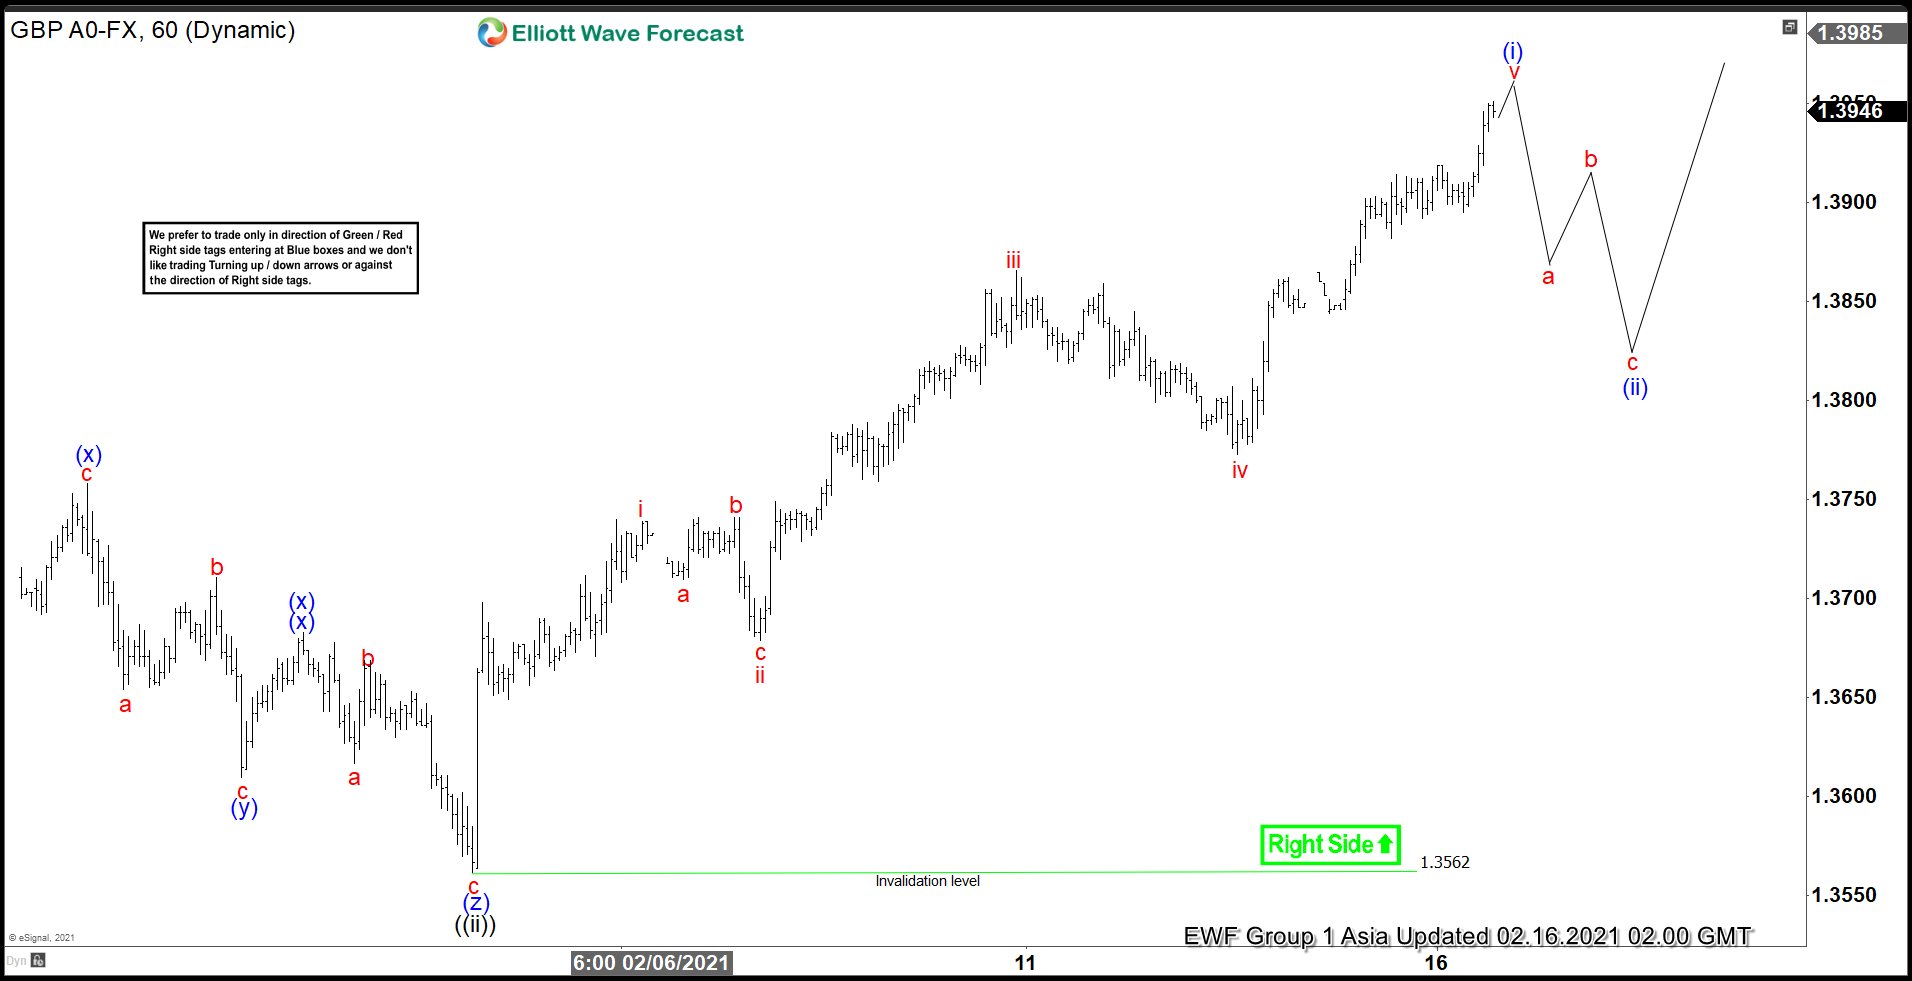
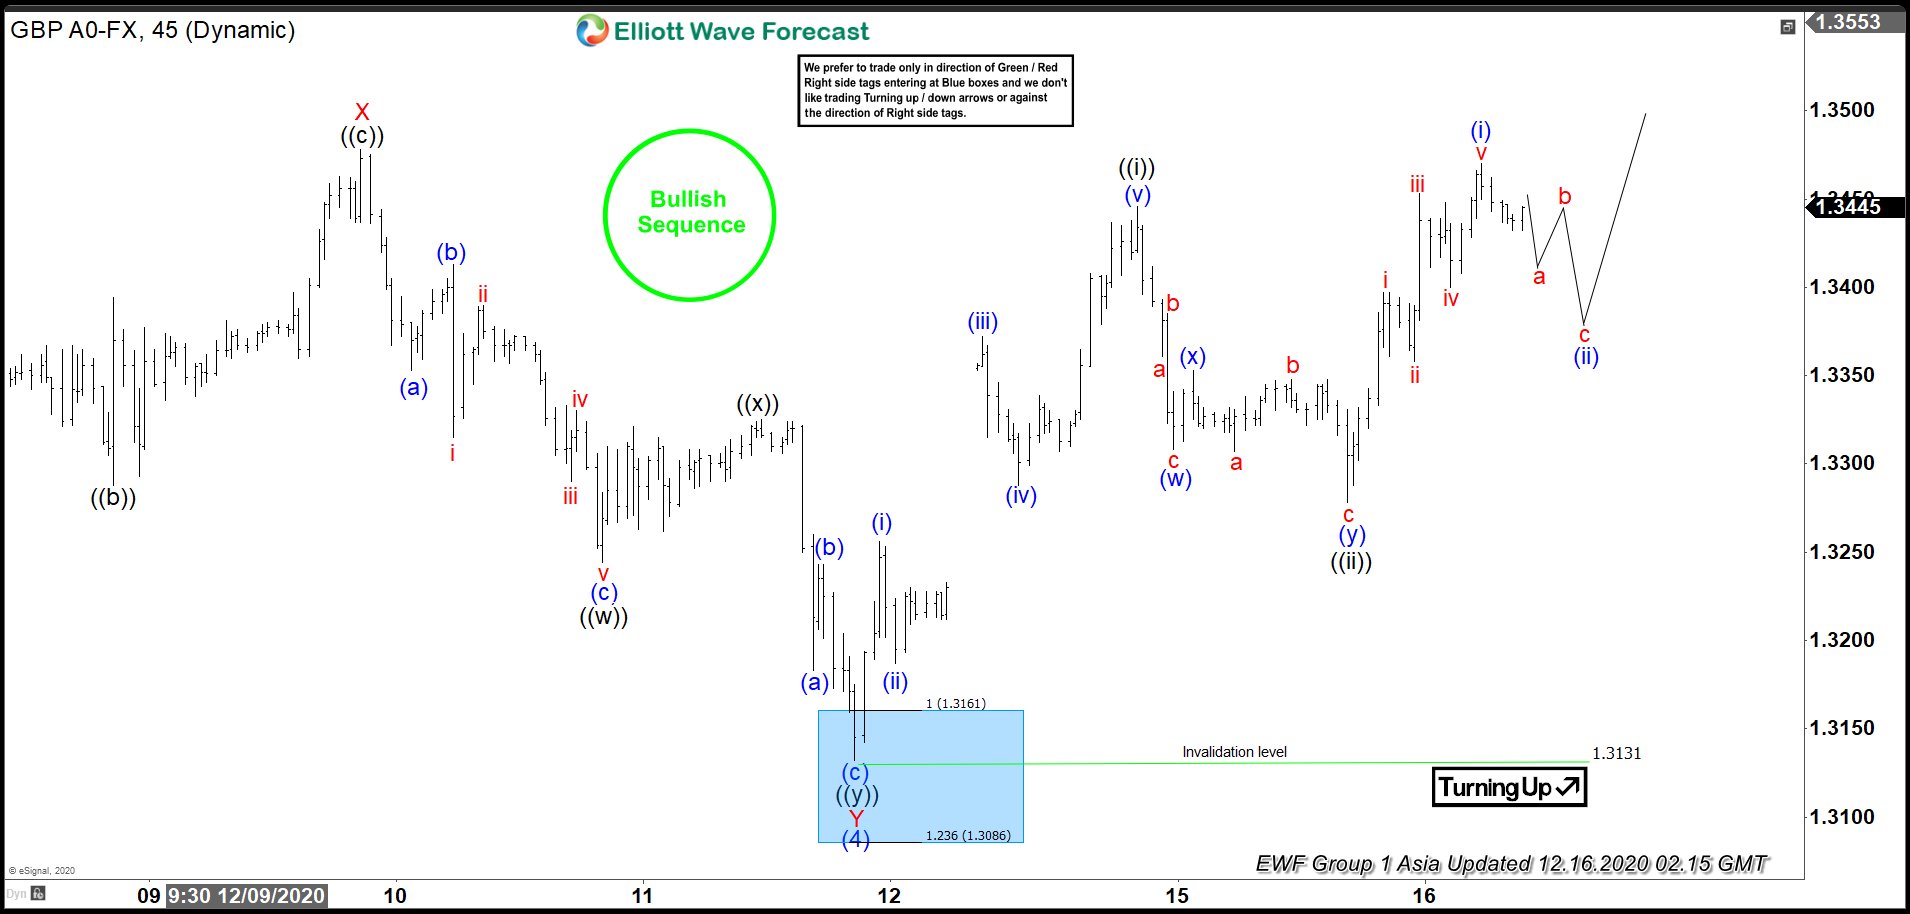
Short Term Elliott Wave View on GBPUSD suggests the rally to 1.4239 ended wave ((W)). Pair is now correcting in wave ((X)) in a larger 3, 7, or 11 swing pullback. Internal of wave ((X)) is proposed to be unfolding as a zigzag Elliott Wave structure. Zigzag is a 5-3-5 structure where wave A and C subdivide into a 5 waves either as impulse or diagonal. Down from wave ((W)), wave 1 ended at 1.408 and bounce in wave 2 ended at 1.4182.
Pair then extended lower in wave 3 towards 1.388, and wave 4 bounce ended at 1.4. The last leg of the impulse wave 5 ended at 1.3857 and this completed wave (A) of the zigzag. Wave (B) rally is currently in progress to correct the 5 waves decline from February 24 high (1.4239). Internal of wave (B) is proposed to be unfolding as a zigzag where the first leg wave A should end soon with a marginal high. Pair should then pullback in wave B then turn higher again in wave C to end wave (B) correction. While wave (B) rally fails below February 24 pivot at 1.4239, expect pair to turn lower again in another 5 waves within wave (C) to complete wave ((X)) pullback.
