
-
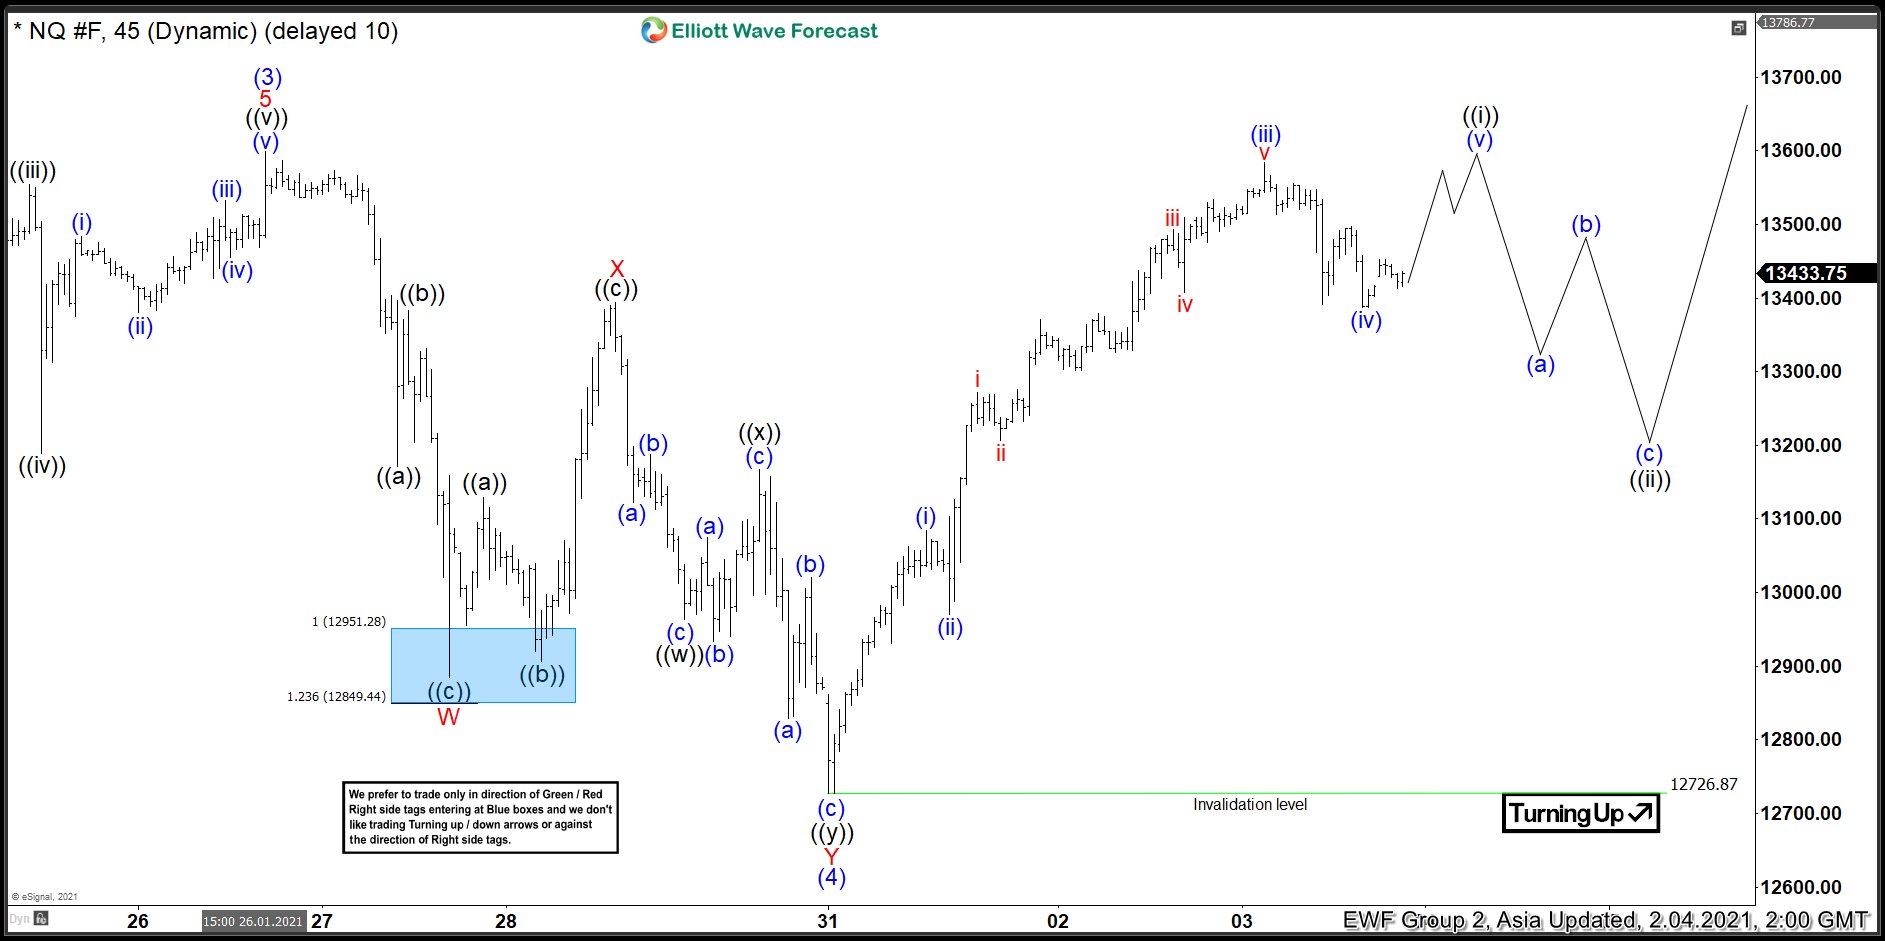
Elliott Wave View: Nasdaq All-Time High Imminent?
Read MoreNasdaq is close to making a new all-time high. In this article and video, we look at the short term Elliott Wave path for the Index.
-
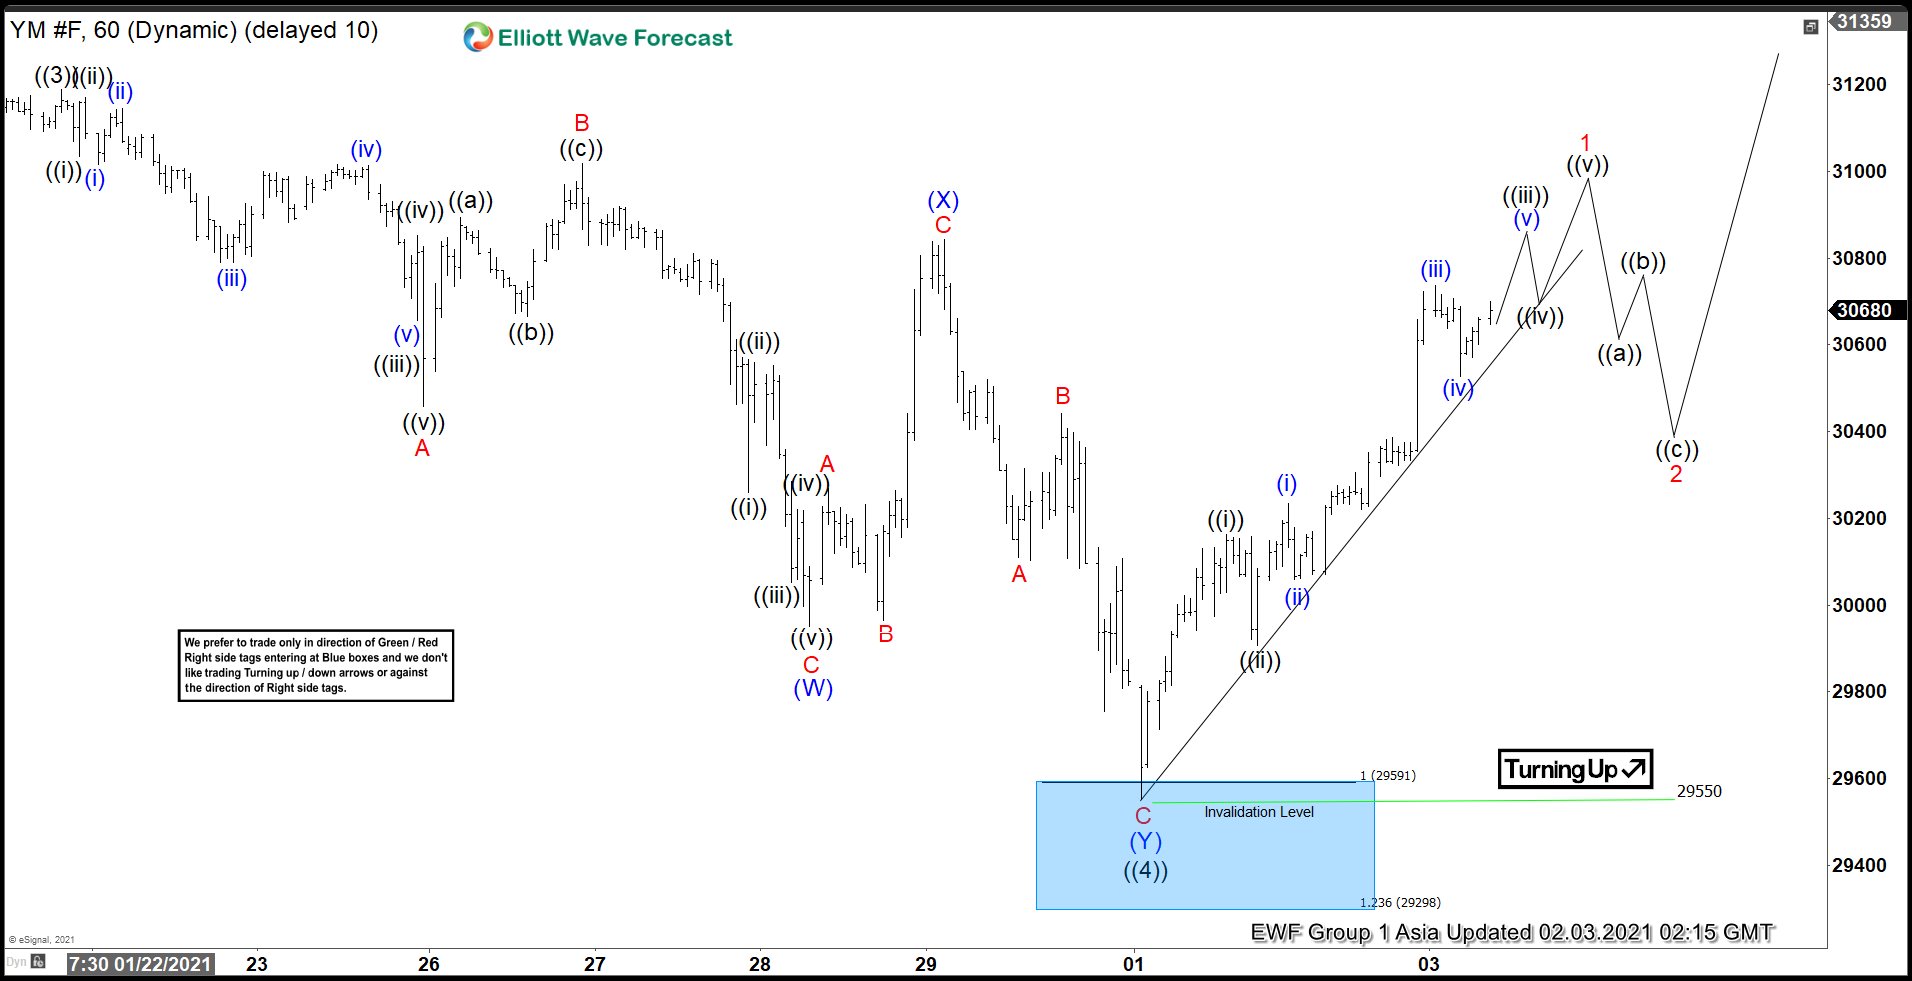
Elliott Wave View: Dow Futures Attempting All-Time High
Read MoreDow Futures Attempts to Rally to New All-Time High. In this article and video, we will look at the Elliott Wave path of the Index.
-
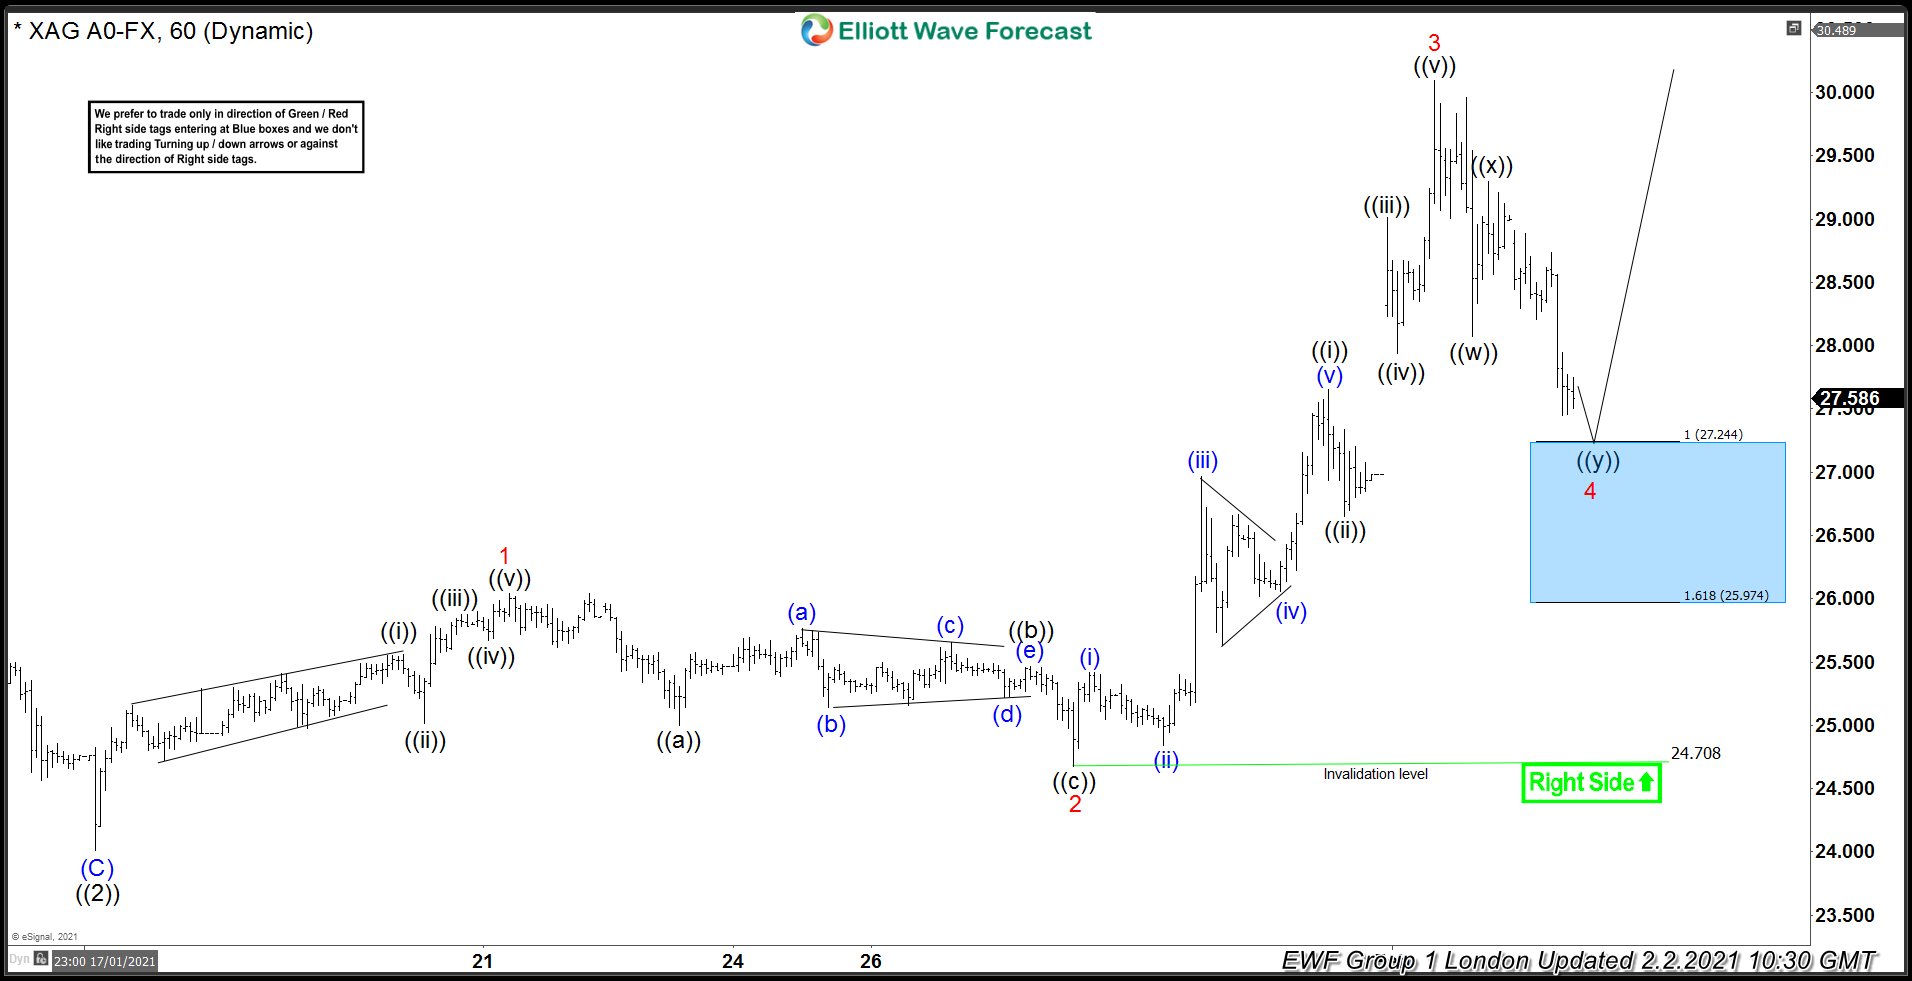
Elliott Wave View: Silver Broke to 52 Week High
Read MoreSilver broke to new 52 week high suggesting the next leg higher has started. This article and video look at the Elliott Wave path.
-
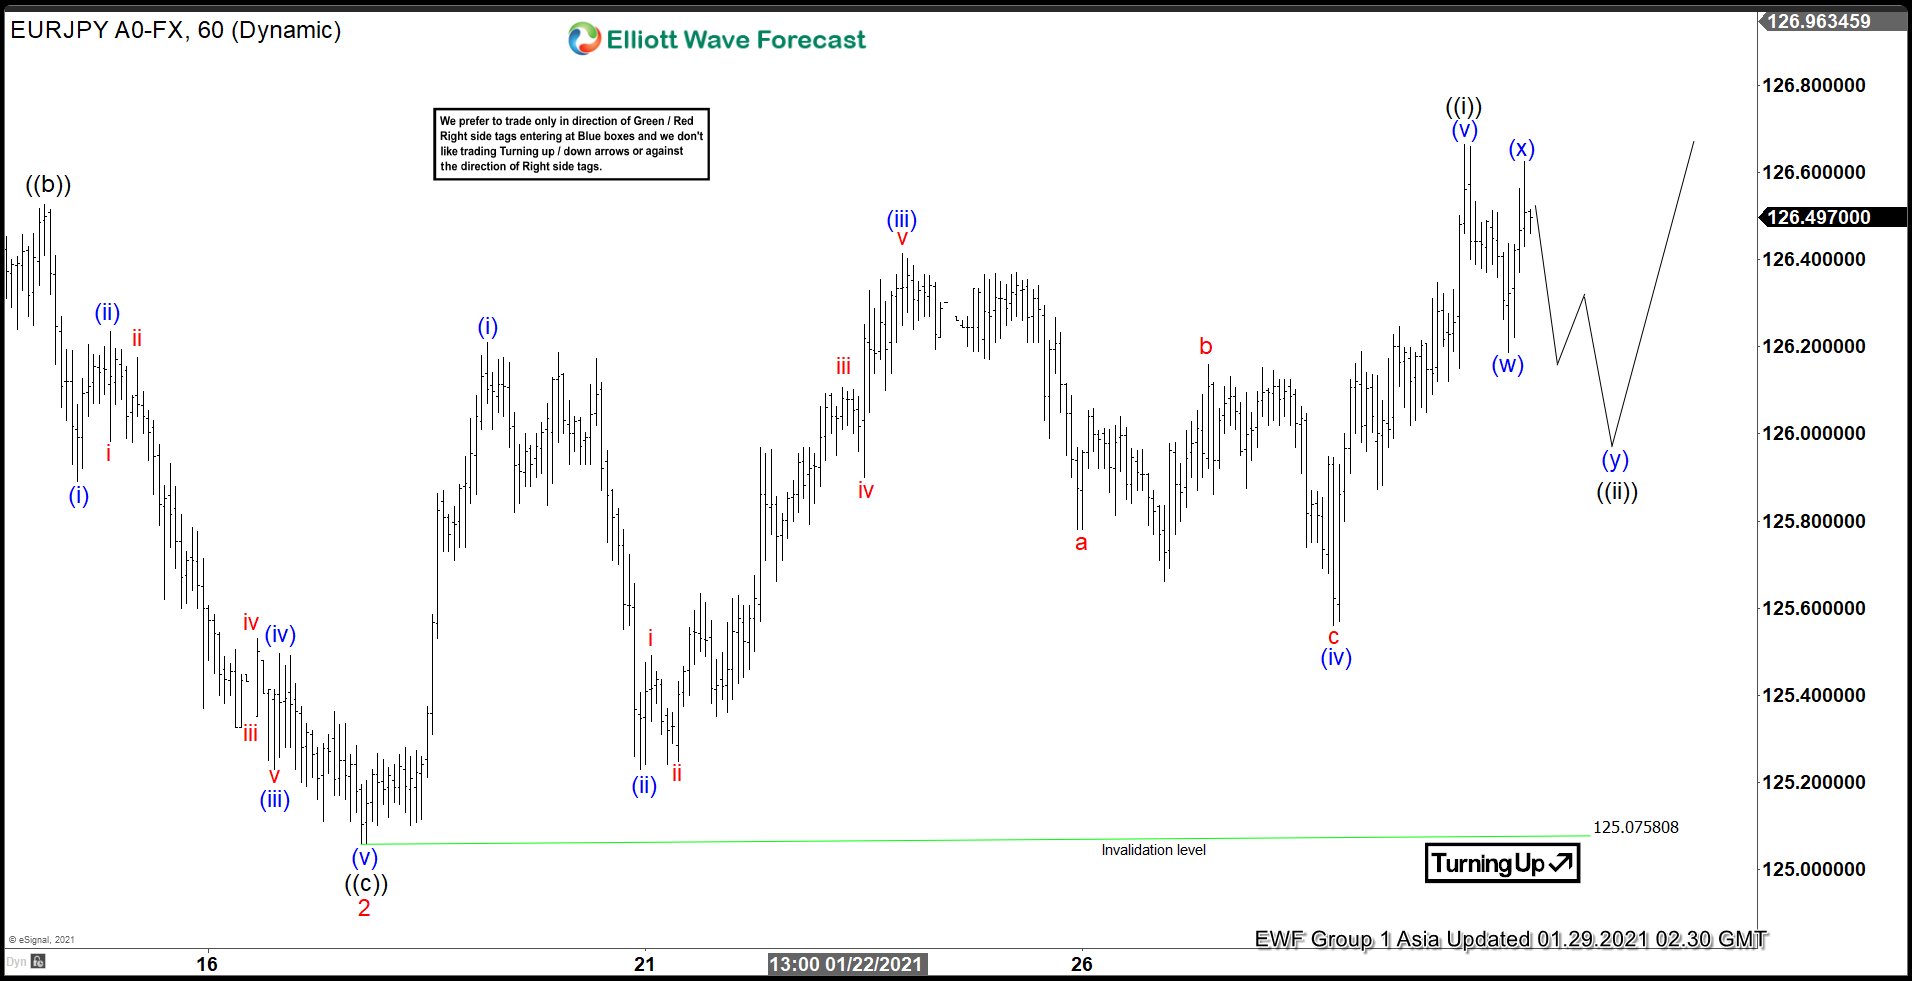
Elliott Wave View: 5 Waves Rally in EURJPY Favors More Upside
Read MoreEURJPY shows a 5 waves diagonal rally from January 18 low favoring more upside. This article and video look at the Elliott Wave path.
-
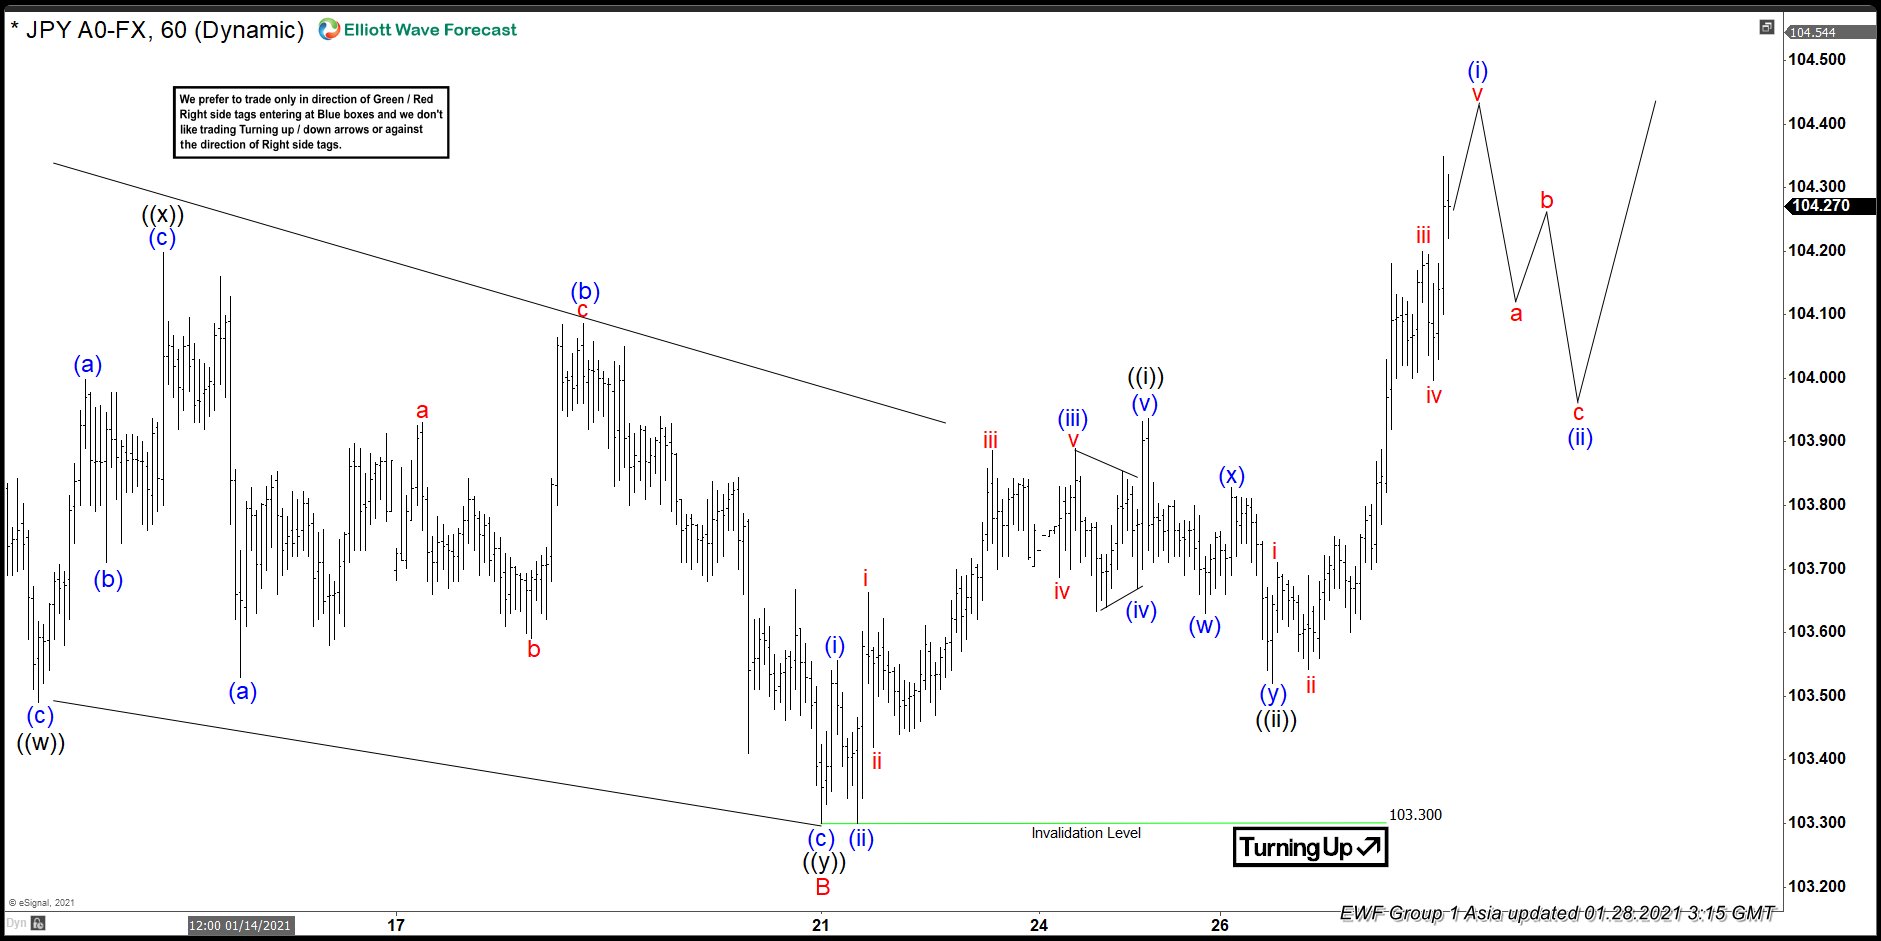
Elliott Wave View: Further Upside in USDJPY
Read MoreUSDJPY shows incomplete sequence from January 6 low favoring more upside. This article and video looks at the Elliott Wave structure.
-
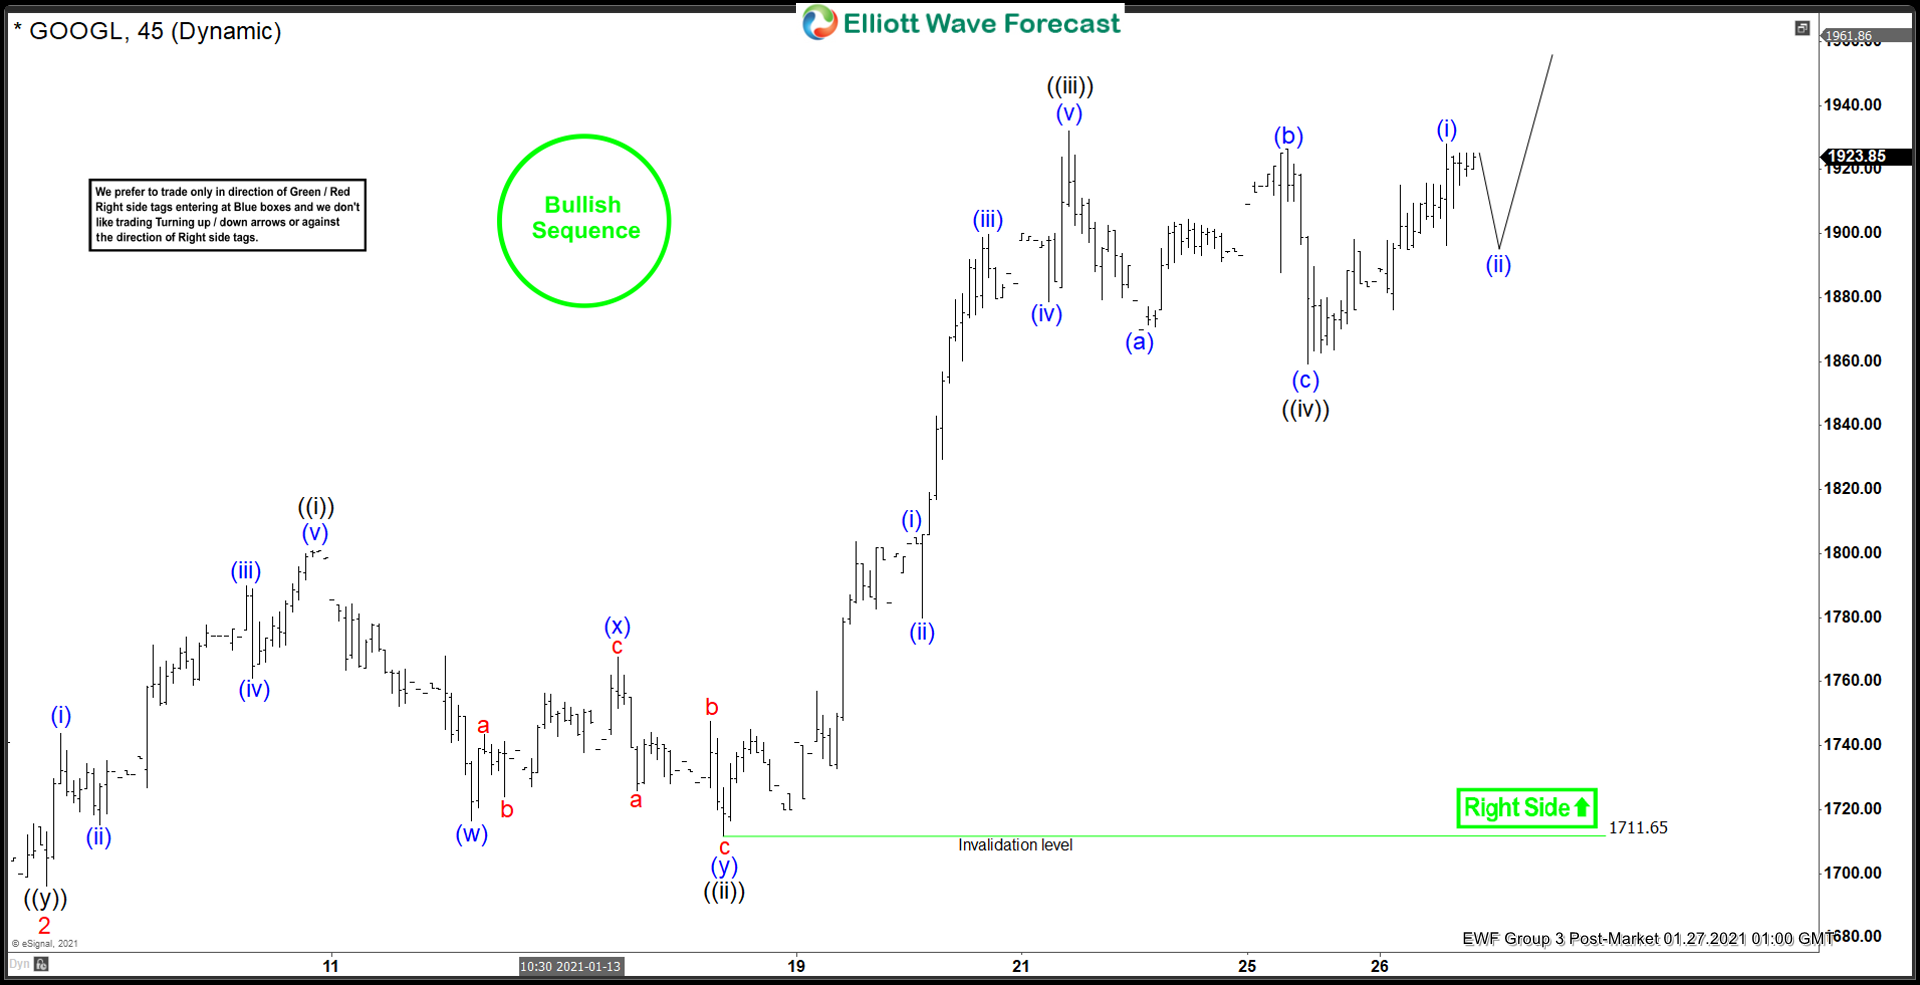
Elliott Wave View: Alphabet (GOOGL) Impulsive Rally Incomplete
Read MoreAlphabet (GOOGL) shows incomplete impulsive structure from December 21 low favoring more upside. This article and video look at the Elliott Wave path.