RELIABLE NASDAQ FORECAST
Daily Accurate Nasdaq Trading Signals
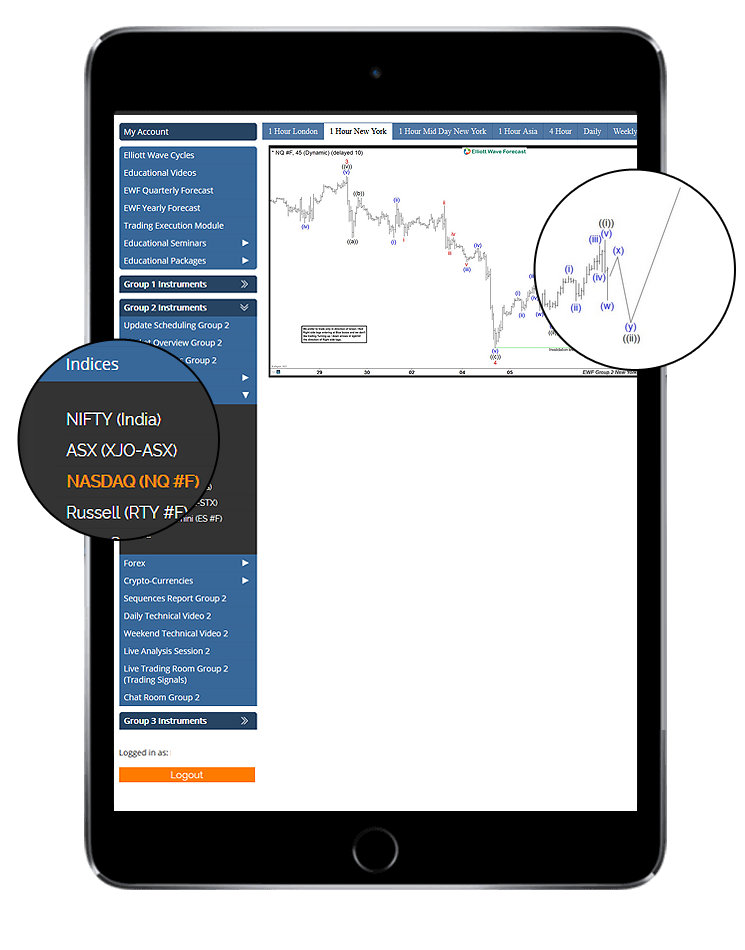
1 Hour, 4 Hour, Daily & Weekly Elliott Wave Counts
Live analysis sessions and trading rooms
Daily technical videos, sequence reports & more…
Nasdaq Trading Signals
The Nasdaq 100 or NAS 100/US100 is a market capitalization-weighted index consisting of over 100 largest non-financial companies. This market capitalization-weighted index is listed on the Nasdaq stock exchange; however, it must be noted that the stock exchanged should not be confused with the weighted composite index Nasdaq 100/NAS 100. Nasdaq 100 can be traded and used as an investment asset for longer-term gains. NAS 100 trading requires ultra-precision for entries due to its high volatile nature and fundamentally driven essence. Managing risk and finding good trade setups is key to becoming consistent in trading NAS 100.
Nasdaq 100 gives exposure to its traders and investors to many companies considering the non-financial sectors of the economy. As U.S. companies with a significant market cap are almost guaranteed to show healthy income annually, the primary trend for this composite index is an uptrend. This feature also makes it an exciting entity to trade. Some of the other reasons for trading/investing in the Nasdaq 100 are following:
● World’s most widely traded and invested index. Volatility is high, as many people take part in trading it.
● Clear uptrends that provide distinctly and elucidate areas of interests and possible exit/entry signals.
● Tighter spreads as Nasdaq provides significant liquidity for their traders and investors. Also, the commissions are competitive as well.
Trade with confidence with exclusive Nasdaq Elliott Wave Forecasts
Why use Elliott Wave Forecast for Nasdaq?
Let our expert analysts help you trade the right side and blue boxes with timely and reliable Nasdaq forecasts.
- Daily & Weekly Technical Videos
- Live Chat Rooms
- Live Analysis Sessions
- Sequence Reports
- Free Education and Learning
- Live Trading Room Sessions
Don't take our word for it. See what our customers say
We take great pride in delivering what we promise. With EWF family growing every single day here's what some of our members have to say.


Nasdaq Forecast & Signals using the Blue Box Approach
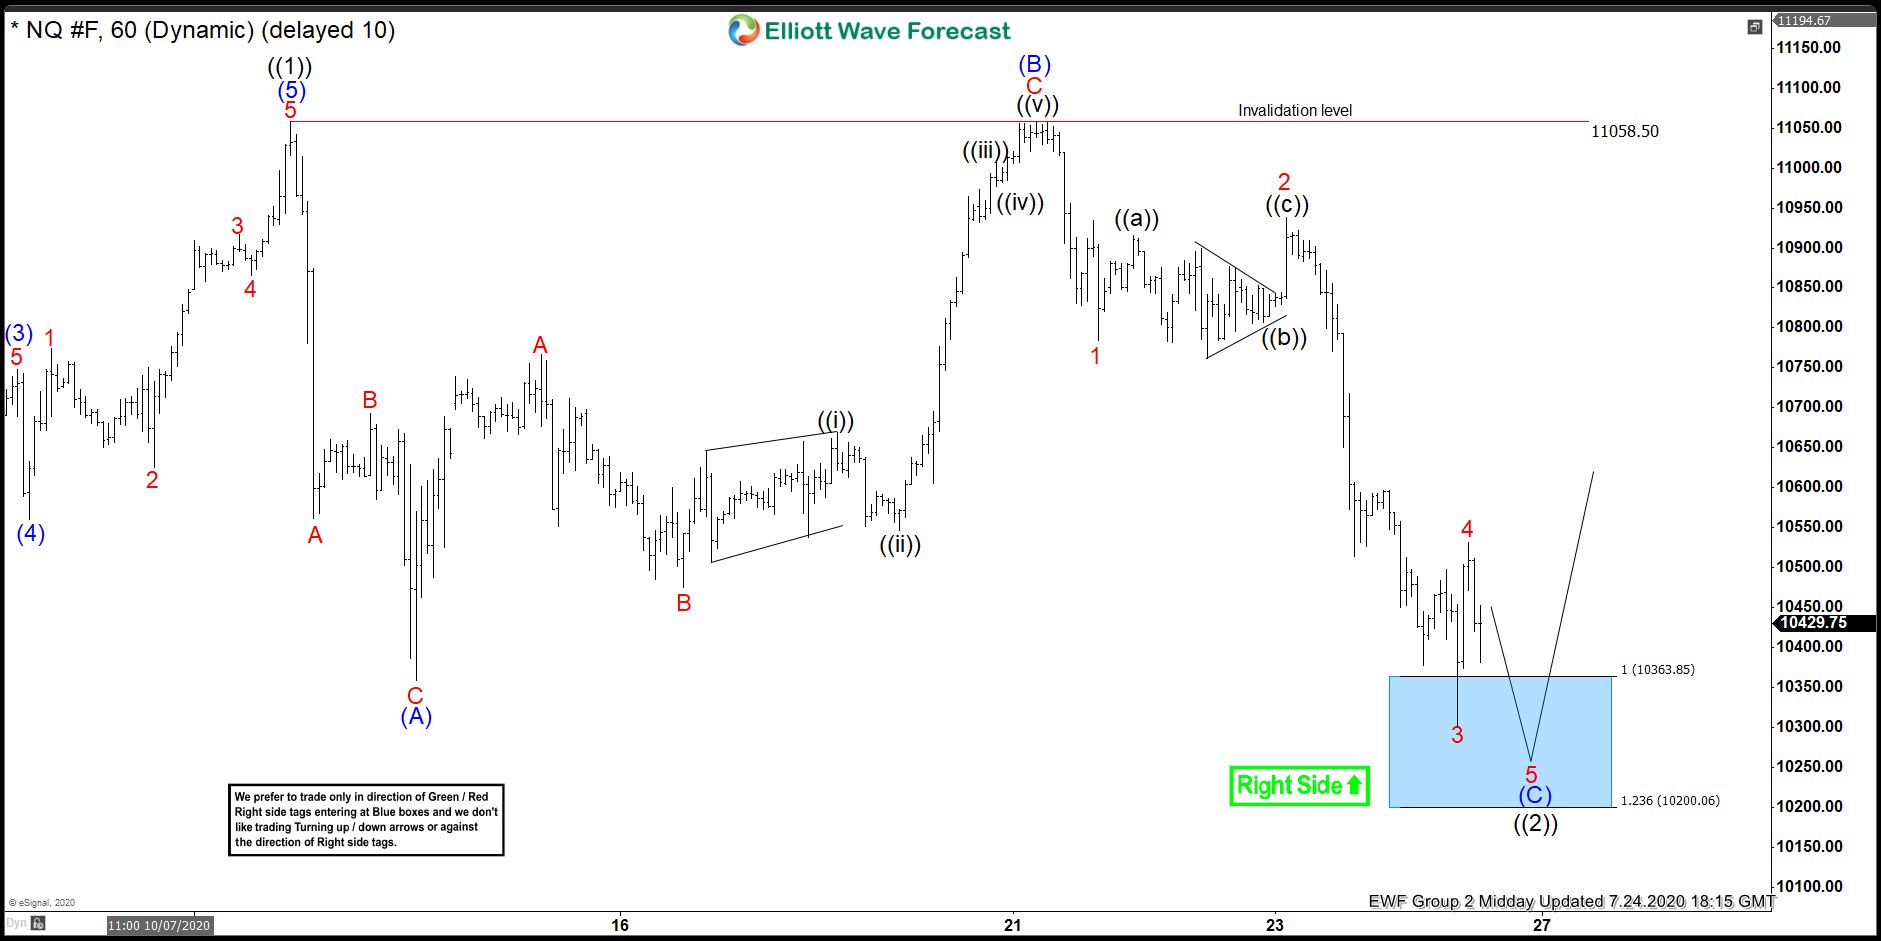
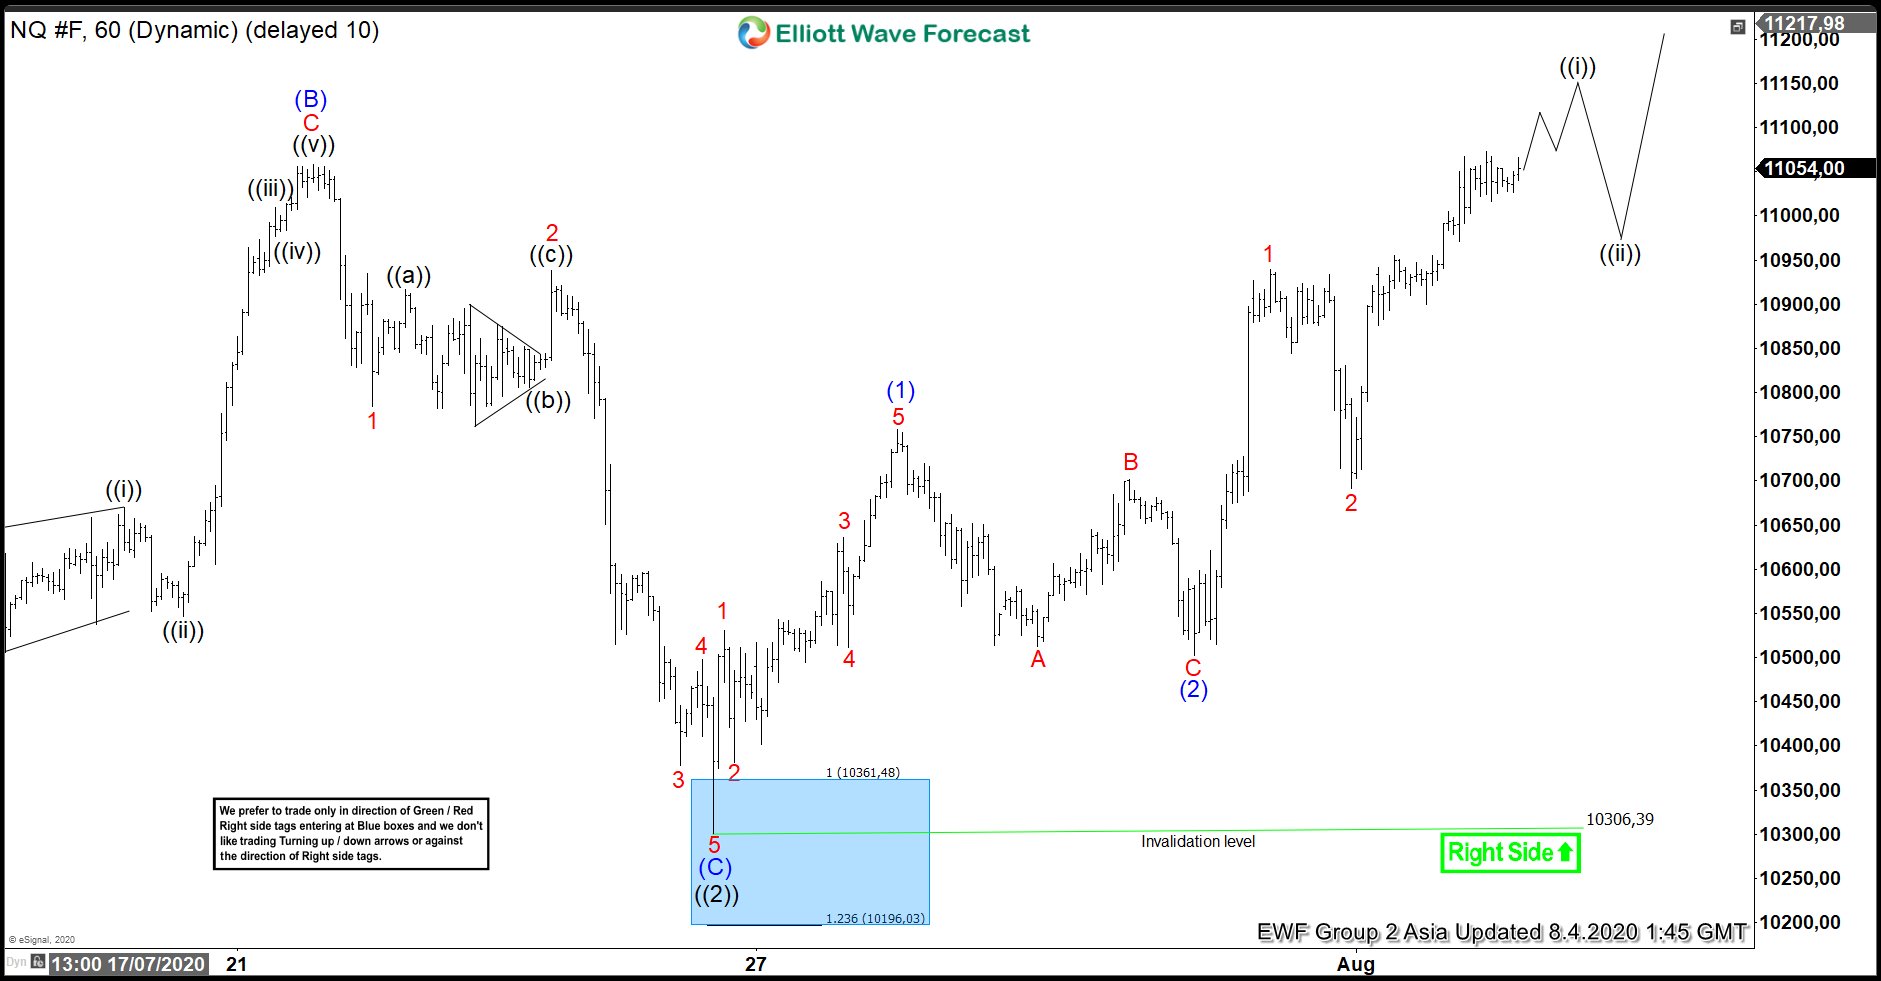
Blue boxes are one of the few concepts and technical systems we use for chart analysis. It is one of the most often used boxes by our analysts at Elliott Wave Forecast. It is structured in such a manner that it assigns high-frequency inflection areas of interest, allowing traders and investors to buy or sell a financial asset, cryptocurrency, asset, or stock at the right time and on the right side of the trend. Our top traders orchestrate blue boxes in areas of the charts where there is a greater risk and likelihood of a trend continuity or trend reversal against our desired goals. Furthermore, the blue boxes contain and reflect the 3, 7, or 11 swings to the finish. Blue boxes are also used by our analysts for many purposes, including the use of Fibonacci extensions in its orchestration. It is also used to achieve profit targets. For example, if we are in a trade and see a blue box forming with high-frequency inflection areas and areas of interest, we would close our current trade and potentially enter a new trade that the blue box has to deliver. It is one of our key trading strategies and has a high degree of probability.
Learn to trade the right side with blue boxes.
Nasdaq Forecast & Signals
Many traders fail in trading the Nasdaq due to a lack of technical proficiency and understanding of the fundamentals. For most novice traders with zero technical ability, trading the Nasdaq requires underlying fundamental analysis that helps gauge the market’s overall direction. This allows novice traders to stay on the right side of the trend and attain fewer losses. Our traders and analysts do not use any fundamental analysis in their overall forecasts at Elliot wave forecast. This is because our traders have years of experience in the markets, we believe that the fundamentals are already priced in, and technical tools are king in predicting the price action. If you want to trade Nasdaq 100 with us, join us today! Nevertheless, if you want to explore what fundamentals drive the price of Nasdaq 100
HOW TO TRADE NASDAQ 100: TOP TIPS & STRATEGIES
Elliott Wave Analysis
As Nasdaq 100 is one of the most traded instruments on the Nasdaq stock exchange, it brings with it tons of volatility and volume. Thus, the trendy nature of the index. Elliott Wave Analysis is a valuable method for trading trending stocks. It aids in analyzing historical market waves and predicting larger future market changes with extreme accuracy and precise entry points. Elliott Wave Analysis’ method involves wave structures, cycles, sequences, and correlated sequences. It is a standard technical tool in the stock market. It applies to every industry, including cryptocurrency! However, as many investment banks advise, the trading strategy should involve many confluences, and you should not focus solely on one technical indicator. As a result, relying exclusively on Elliot wave analysis to make trading decisions can be a recipe for disaster. We at Elliott Wave Forecast employ a range of analytical methods to help us assess the market more effectively and place detailed and timely entry orders. Elliot wave models, market correlations, Fibonacci, trendlines, market dynamics, and sequences are some of our technical and analysis methods. Such technical instruments allow us to track the demand with extreme precision and remain on the right side of the trend. The word “right hand” is used at Elliott Wave Forecast to refer to the general trend’s trajectory as well as our rhetoric regarding the market’s trend. For instance, if we refer to the trend as the right side, we are referring to the trend’s particular position (bullish or bearish). if you are looking for trading Nasdaq 100, Elliott wave forecast is the best for Nasdaq predictions and Nasdaq technical analysis.
Fibonacci
Many people understand Fibonacci, but it is not used to its full potential. It provides substantial probability numbers for possible trend retracements and extensions. As a result, it is widespread and significant among traders and investors. We at Elliot wave forecast incorporate Fibonacci into our already developed trading framework. For example, we use Elliot wave analysis and sequences in conjunction with Fibonacci extensions and retracements to achieve a more detailed and accurate view of the market.
Trendlines
Trendlines, in a nutshell, are one of the most common technical tools among traders due to their ease of use. Regardless of their design, trendlines are extraordinarily effective and accurate technical instruments. The majority of traders use it as an additional confluence for their entry or exit orders. We at Elliot wave forecast use it for a number of purposes. One of the primary factors is to determine the essence and severity of the trend. We also use various indicators with trendlines, such as RSI and distribution mechanisms, to build a highly probable and accurate trading system with trendlines.
Market Correlations
Our analysts utilize the first- and second-dimension correlation system to attain a more precise and accurate correlation of a specific pair across different asset classes. Having a correlation system as part of our trading plan allows us to make wiser decisions and elevate our overall trading style.
Crypto & more. Covering up to 78 instruments globally.
