
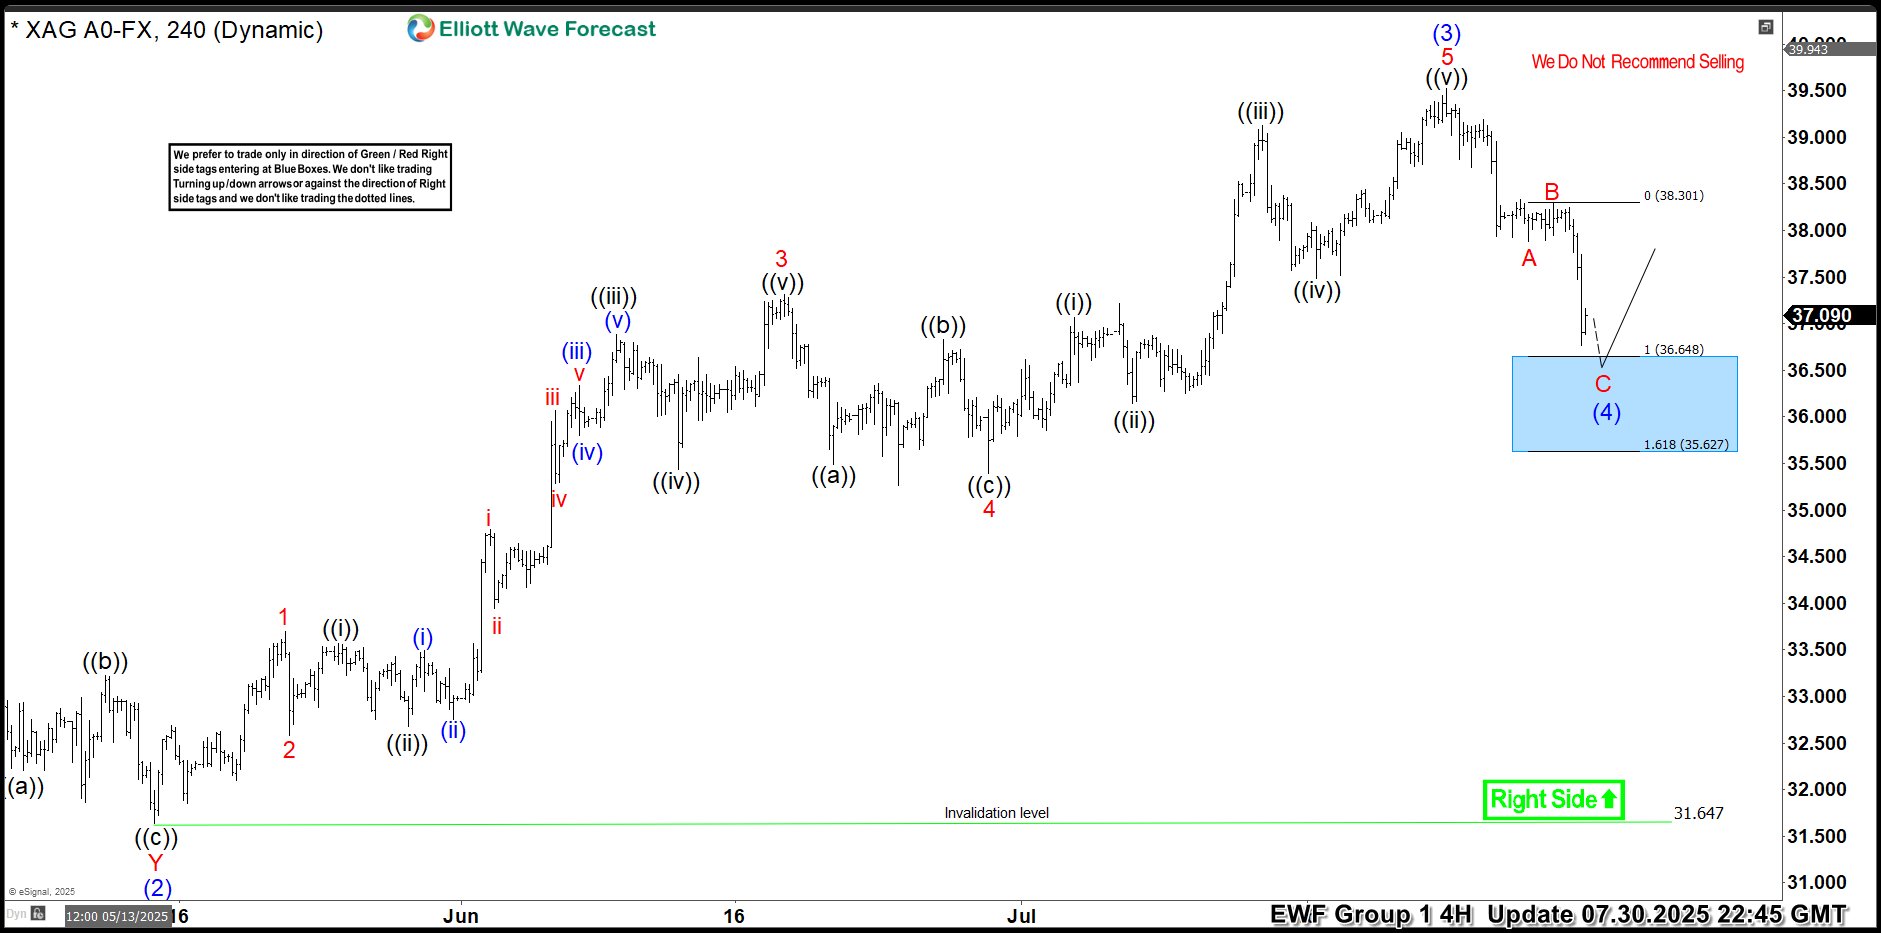
Hello traders. As our members know, we have had many profitable trading setups recently. In this technical article, we are going to talk about another Elliott Wave trading setup we got in Silver (XAGUSD). The commodity has completed its correction exactly at the Equal Legs zone, also known as the Blue Box Area. In this […]
-
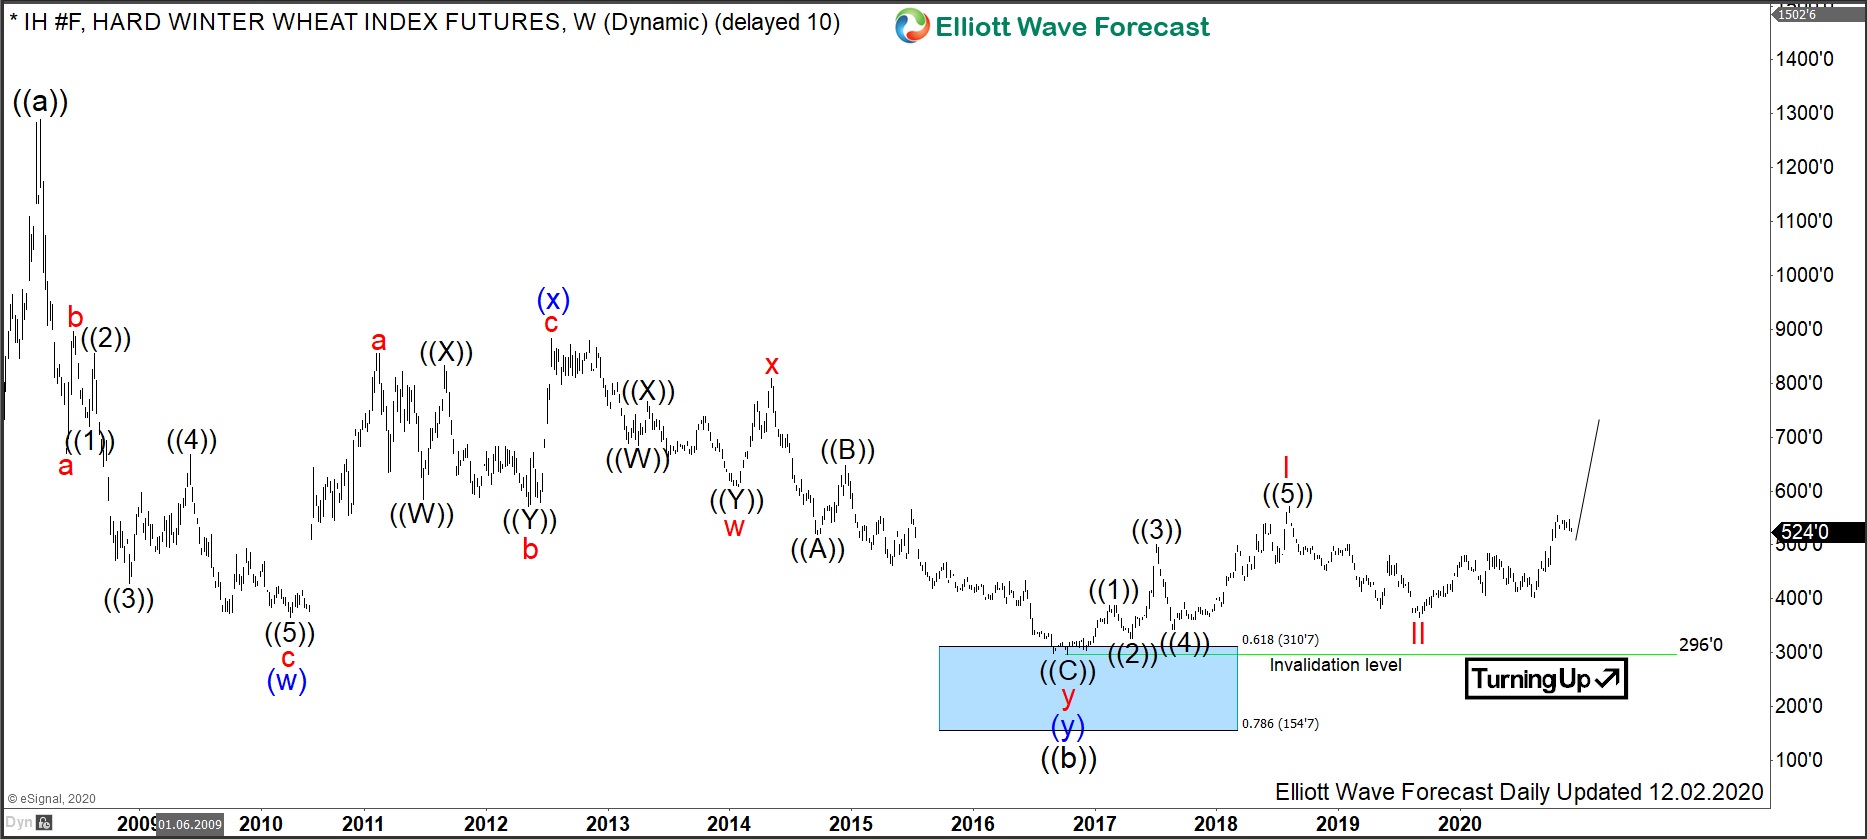
Will Rising Prices in Hard Red Winter Wheat Make Bread Lovers Suffer?
Read MoreHard Red Winter Wheat is one of the grain commodities, along with soft red wheat, corn, soybeans and others. Within the wheat family, first of all, there is a fundamental difference between two wheat types. Soft wheat is low in protein and is basically used in cakes in pastries. By contrast, hard wheat has a […]
-
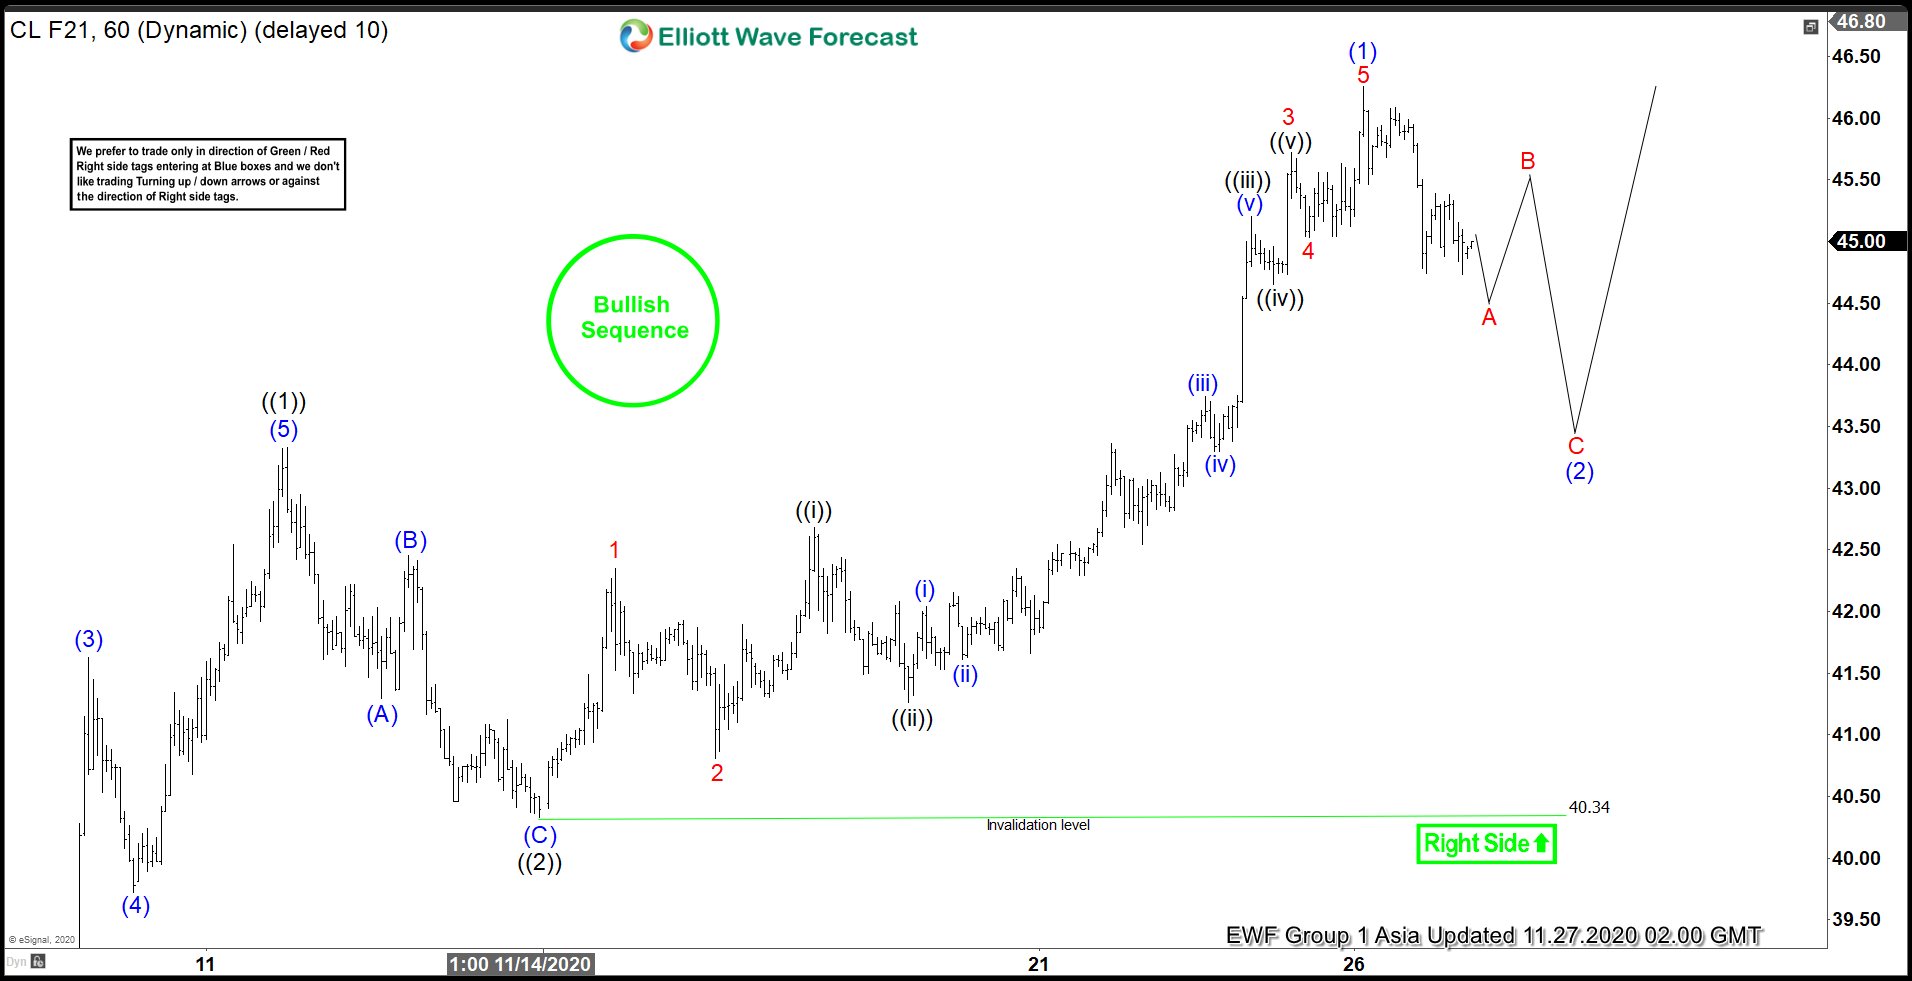
Elliott Wave View: Pullback in Oil Should Stay Supported
Read MoreOil shows a bullish sequence from April low and should continue to be supported in 3, 7, 11 swing. This article and video look at the Elliott Wave path.
-
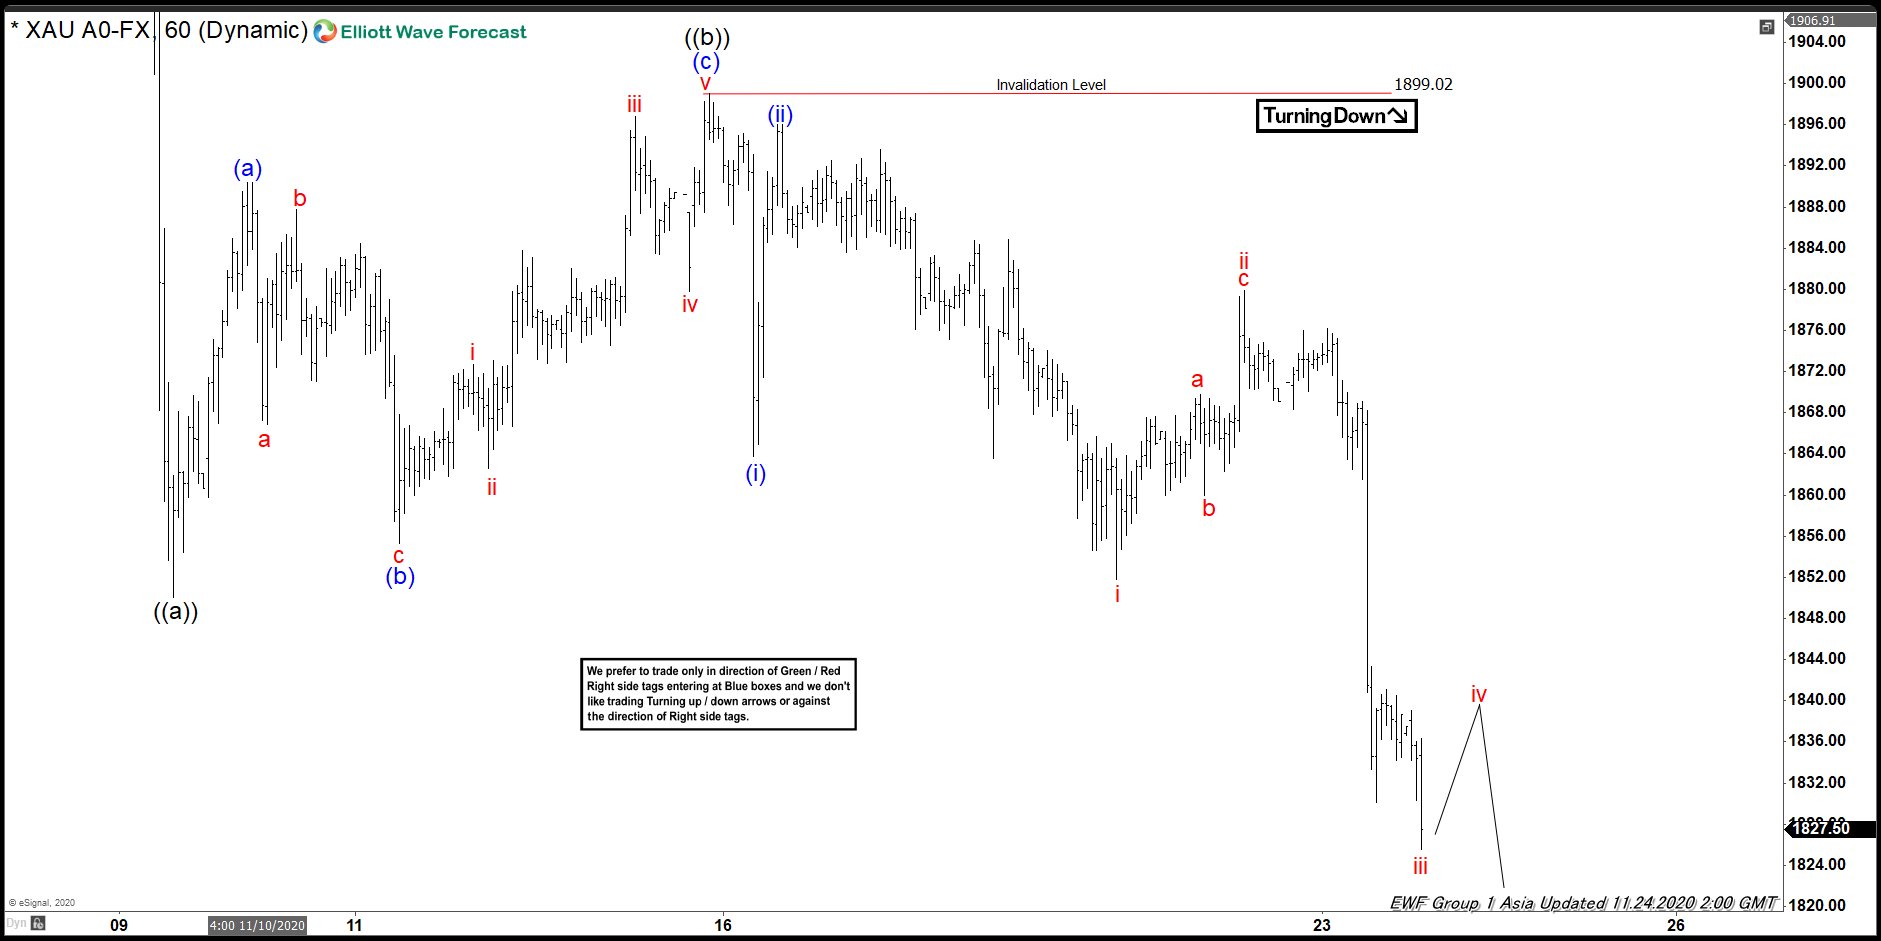
Elliott Wave View: Potential Target for Gold’s Correction
Read MoreShort Term Elliott Wave view in Gold (XAUUSD) suggests the metal continues the correction lower. The internal of the decline from November 9 peak is unfolding as a zigzag Elliott Wave structure. Down from November 9 peak, wave ((a)) ended at 1850. Up from there, bounce in wave ((b)) unfolded as a zigzag in lesser […]
-
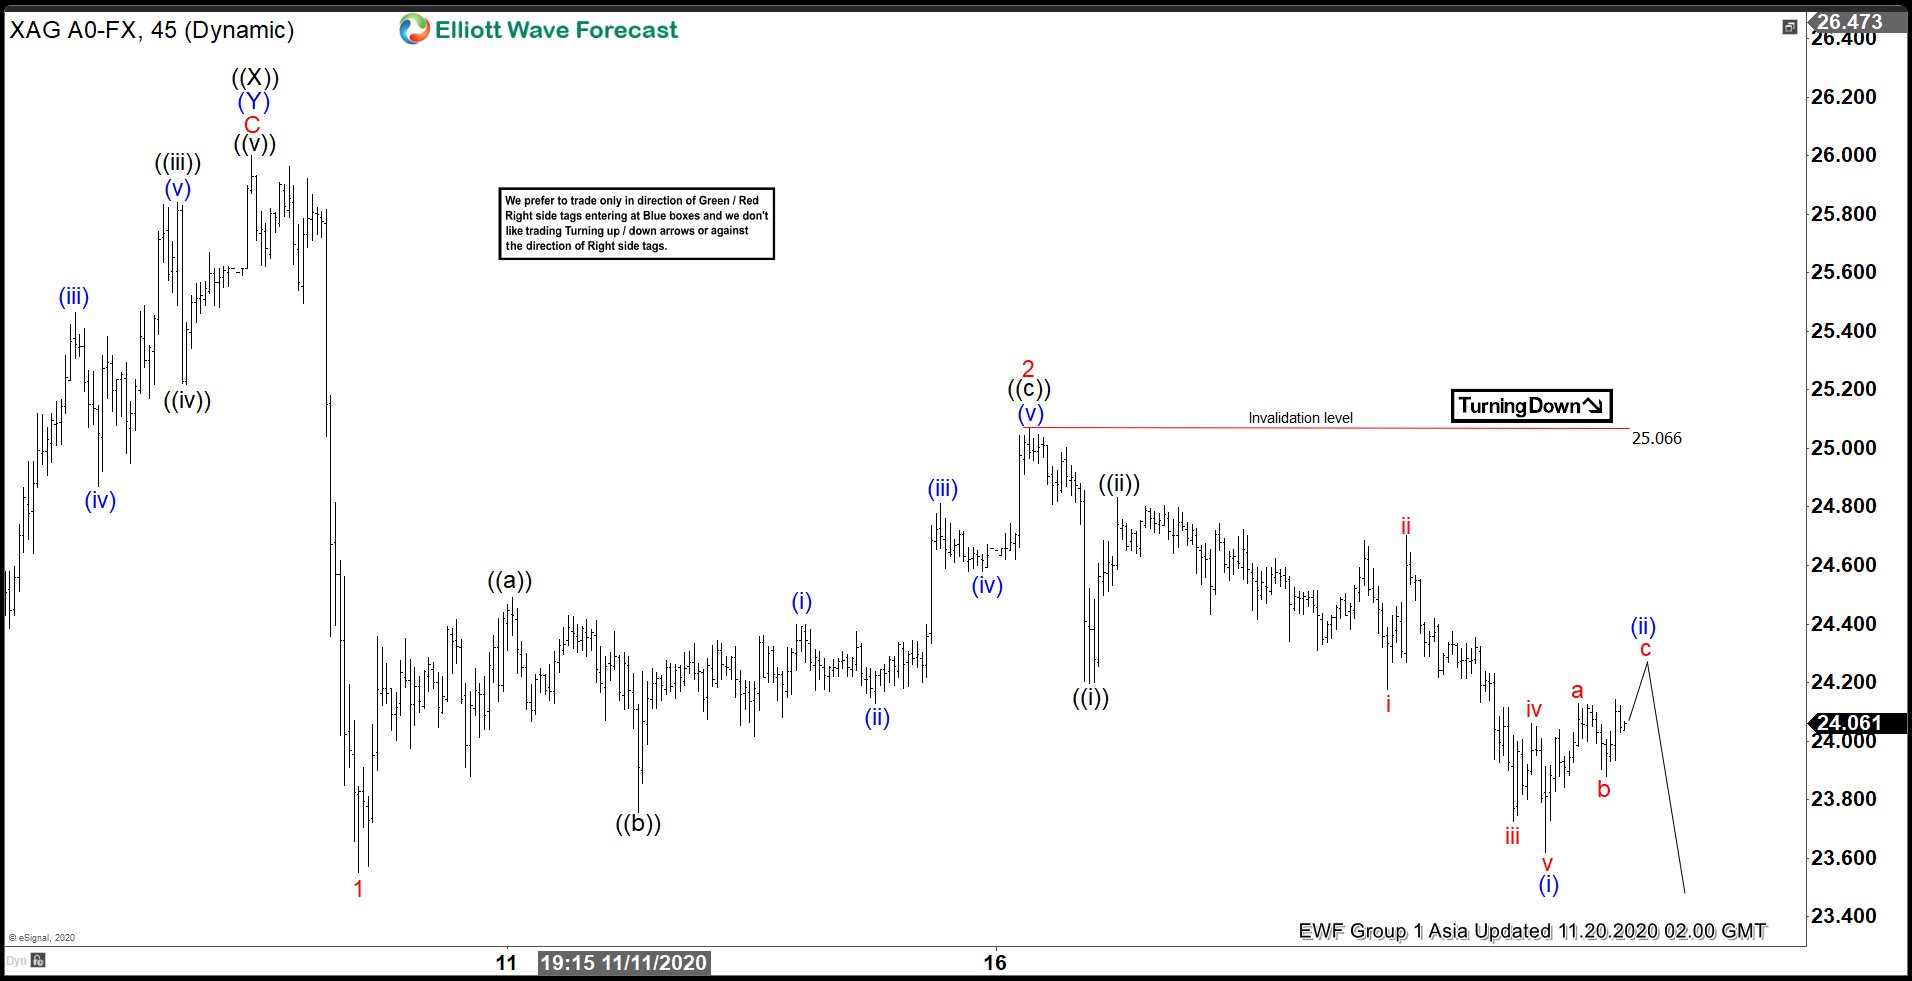
Elliott Wave View: Short Term Weakness in Silver Still Expected
Read MoreSilver (XAGUSD) decline from Nov 9 high looks impulsive and still has scope to see further weakness. This article and video look at the Elliott Wave path.
-
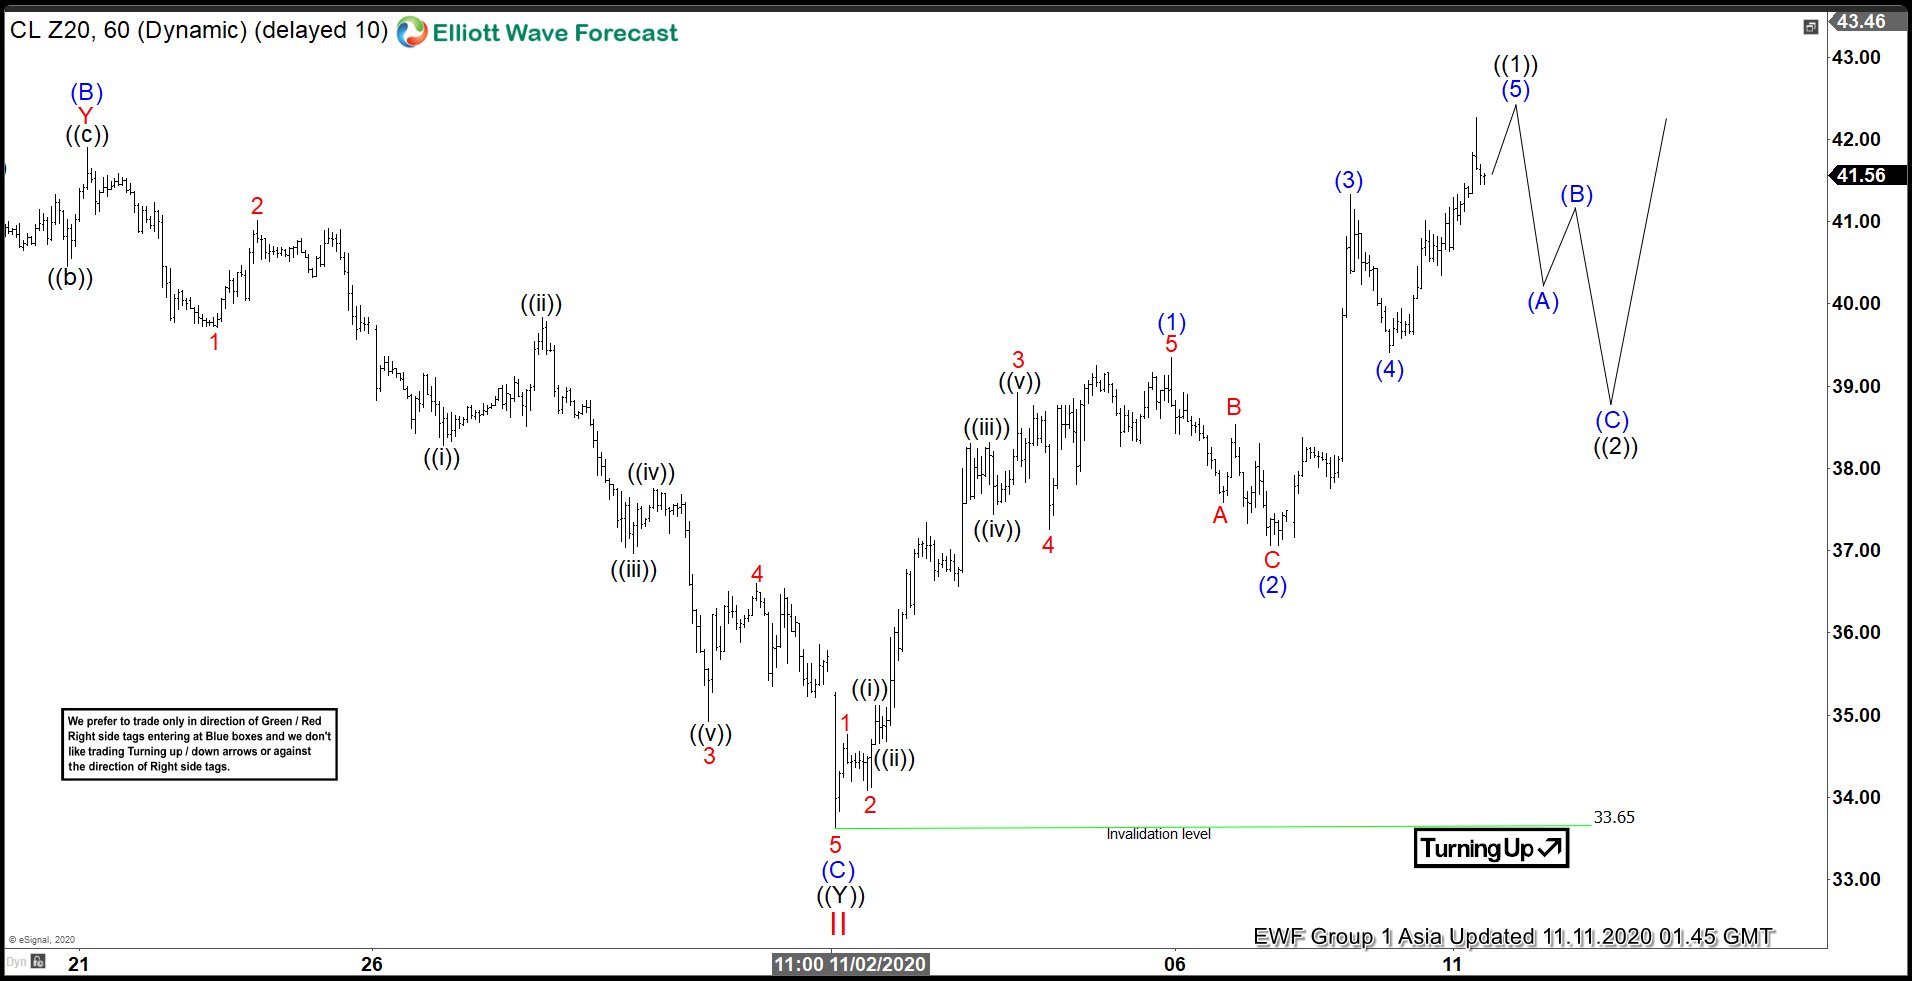
Elliott Wave View: Bullish Outlook in Oil (CL)
Read MoreOil shows a 5 waves rally from November 2 low suggesting further upside is likely. This article and video look at the Elliott Wave path.
-
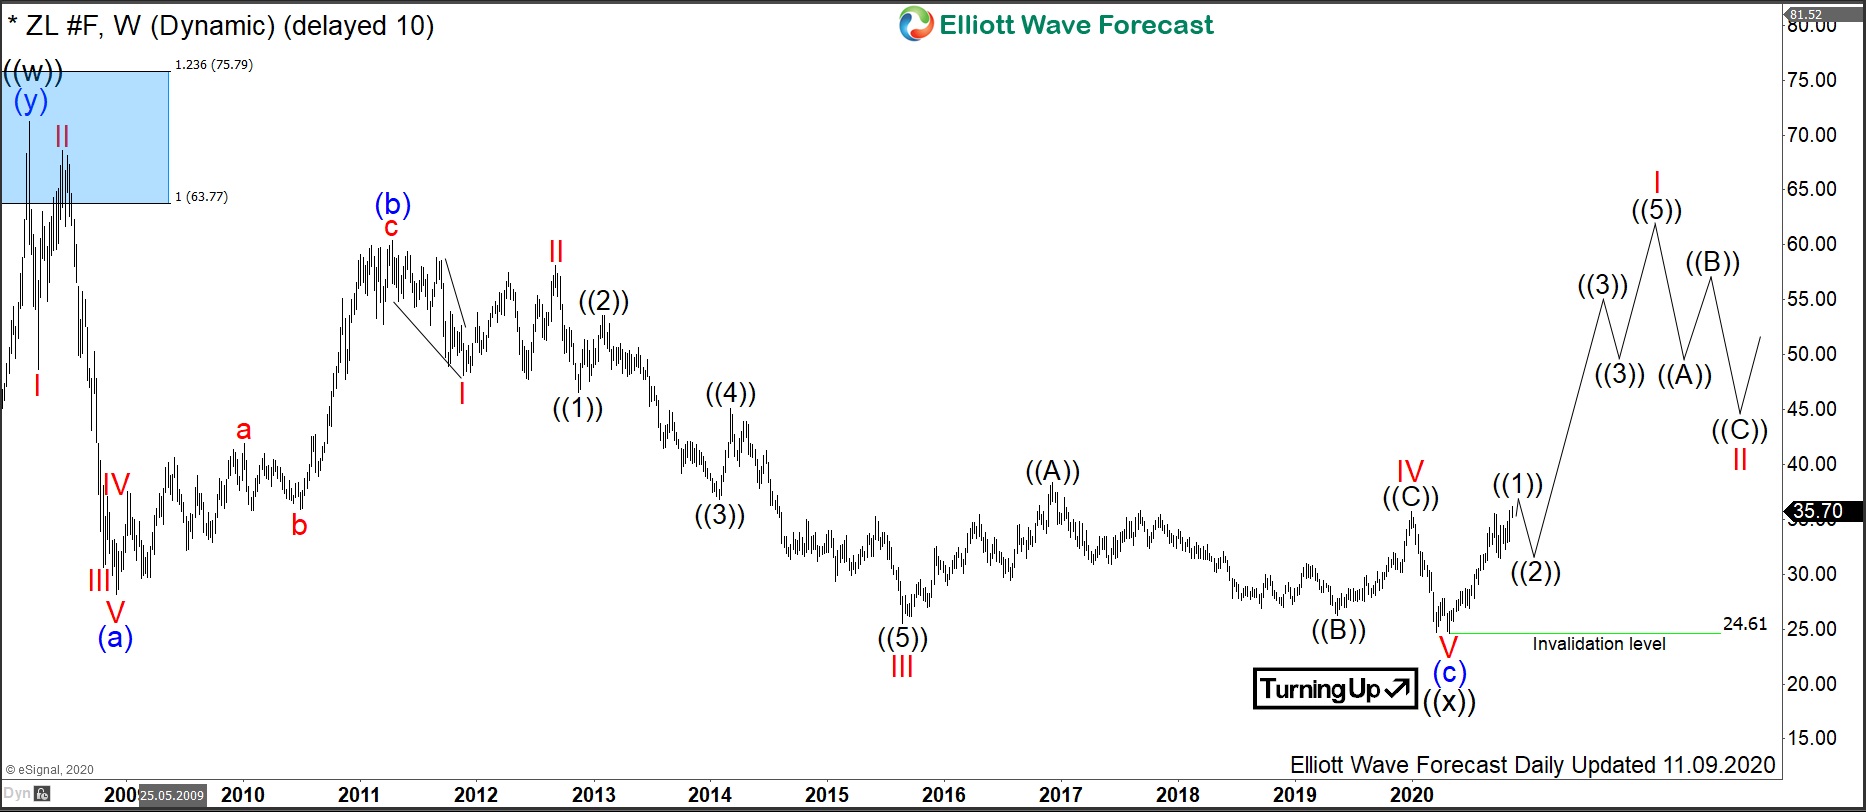
ZL #F: Soybean Oil Turning Higher Will Make Cooking Expensive
Read MoreSoybean Oil is one of the grain & oilseed commodities, along with wheat, soybeans, corn, rice, oats and others. Just behind palm oil, it is the second most used vegetable oil, basically, for frying and baking. Also, soybean oil finds applications medically and, when processed, for printing inks and oil paints. One can trade Soybean […]