
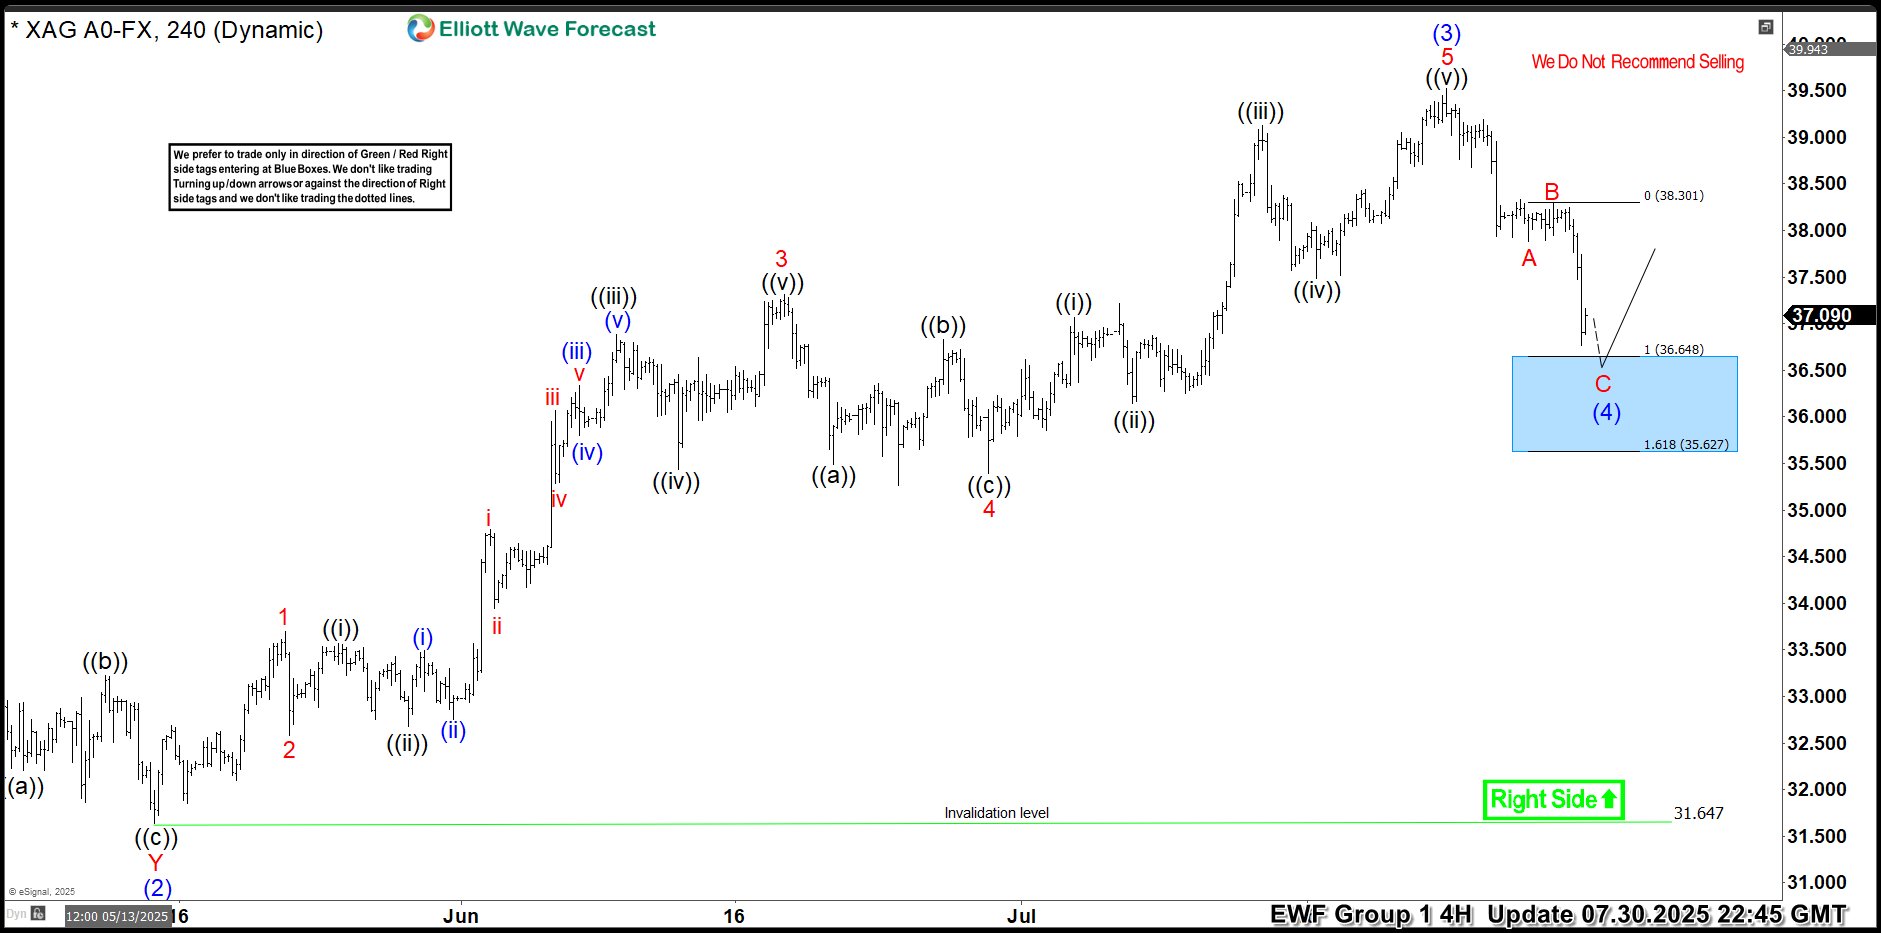
Hello traders. As our members know, we have had many profitable trading setups recently. In this technical article, we are going to talk about another Elliott Wave trading setup we got in Silver (XAGUSD). The commodity has completed its correction exactly at the Equal Legs zone, also known as the Blue Box Area. In this […]
-
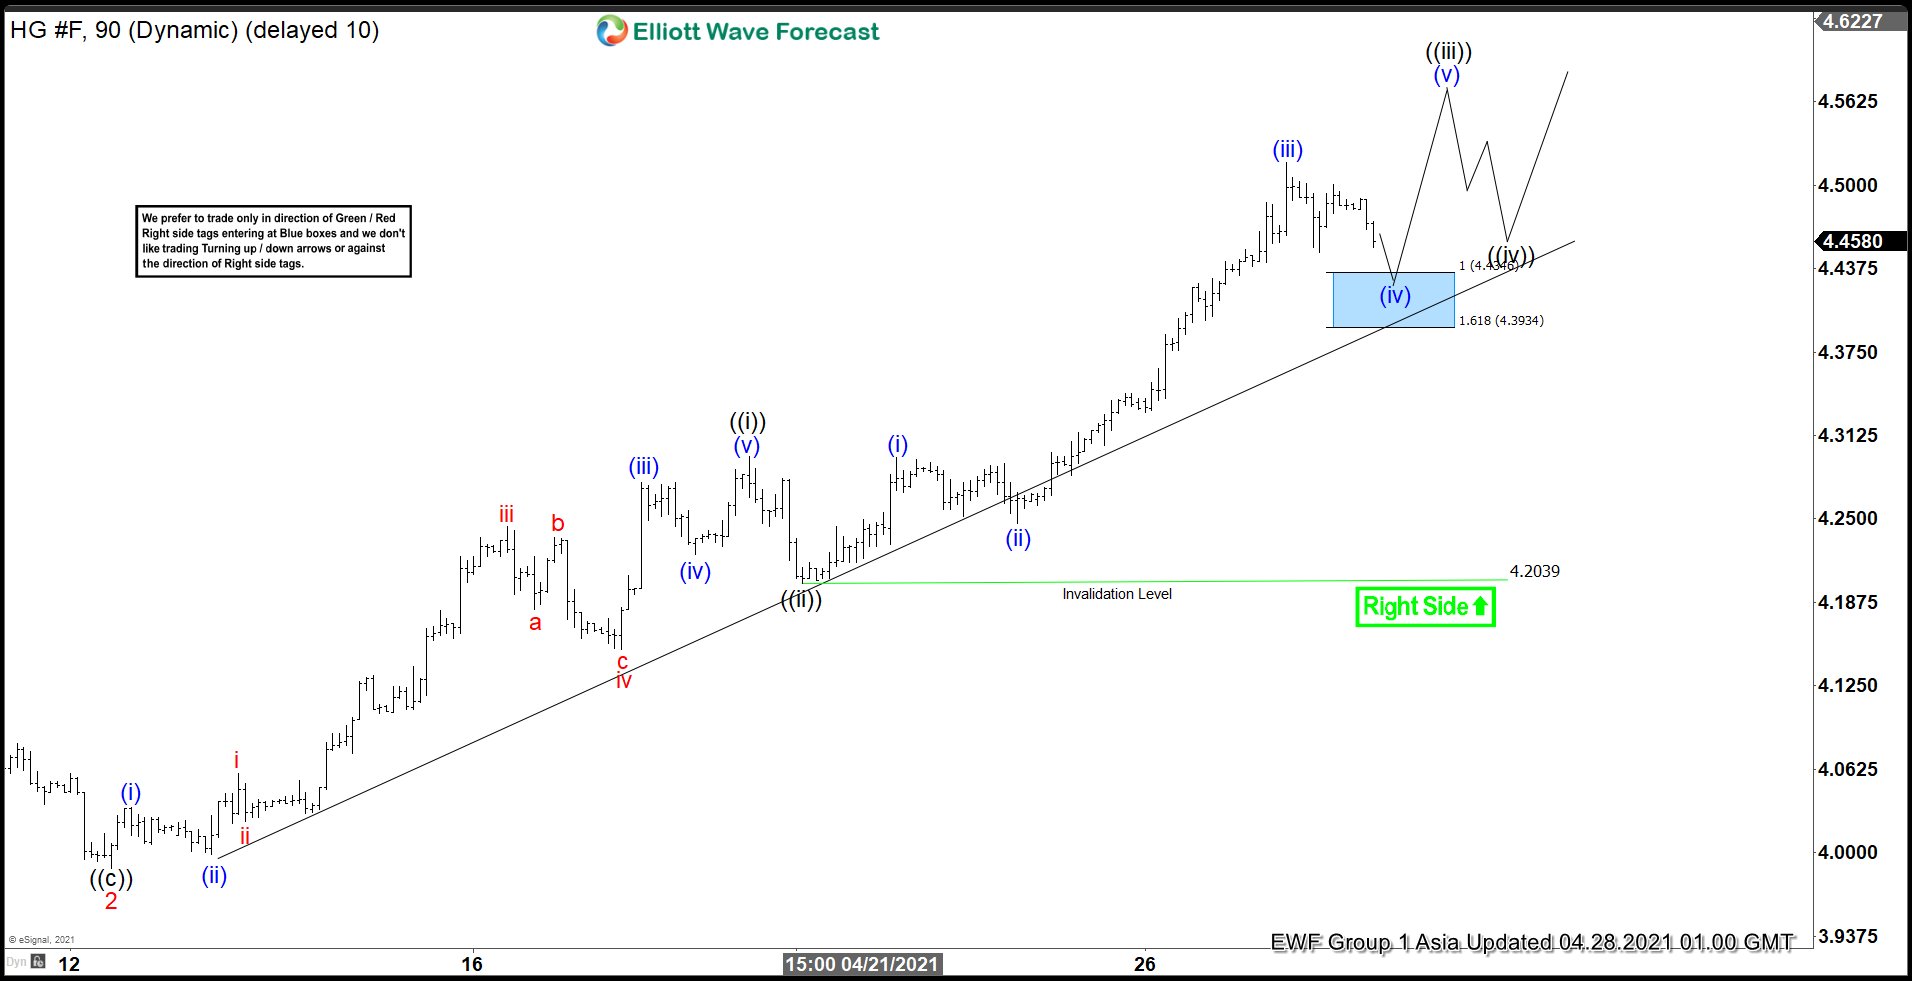
Elliott Wave View: Copper Should Remain Supported
Read MoreCopper has made a 10 year high and should continue to rally higher. This article and video look at the Elliott Wave path of the metal.
-
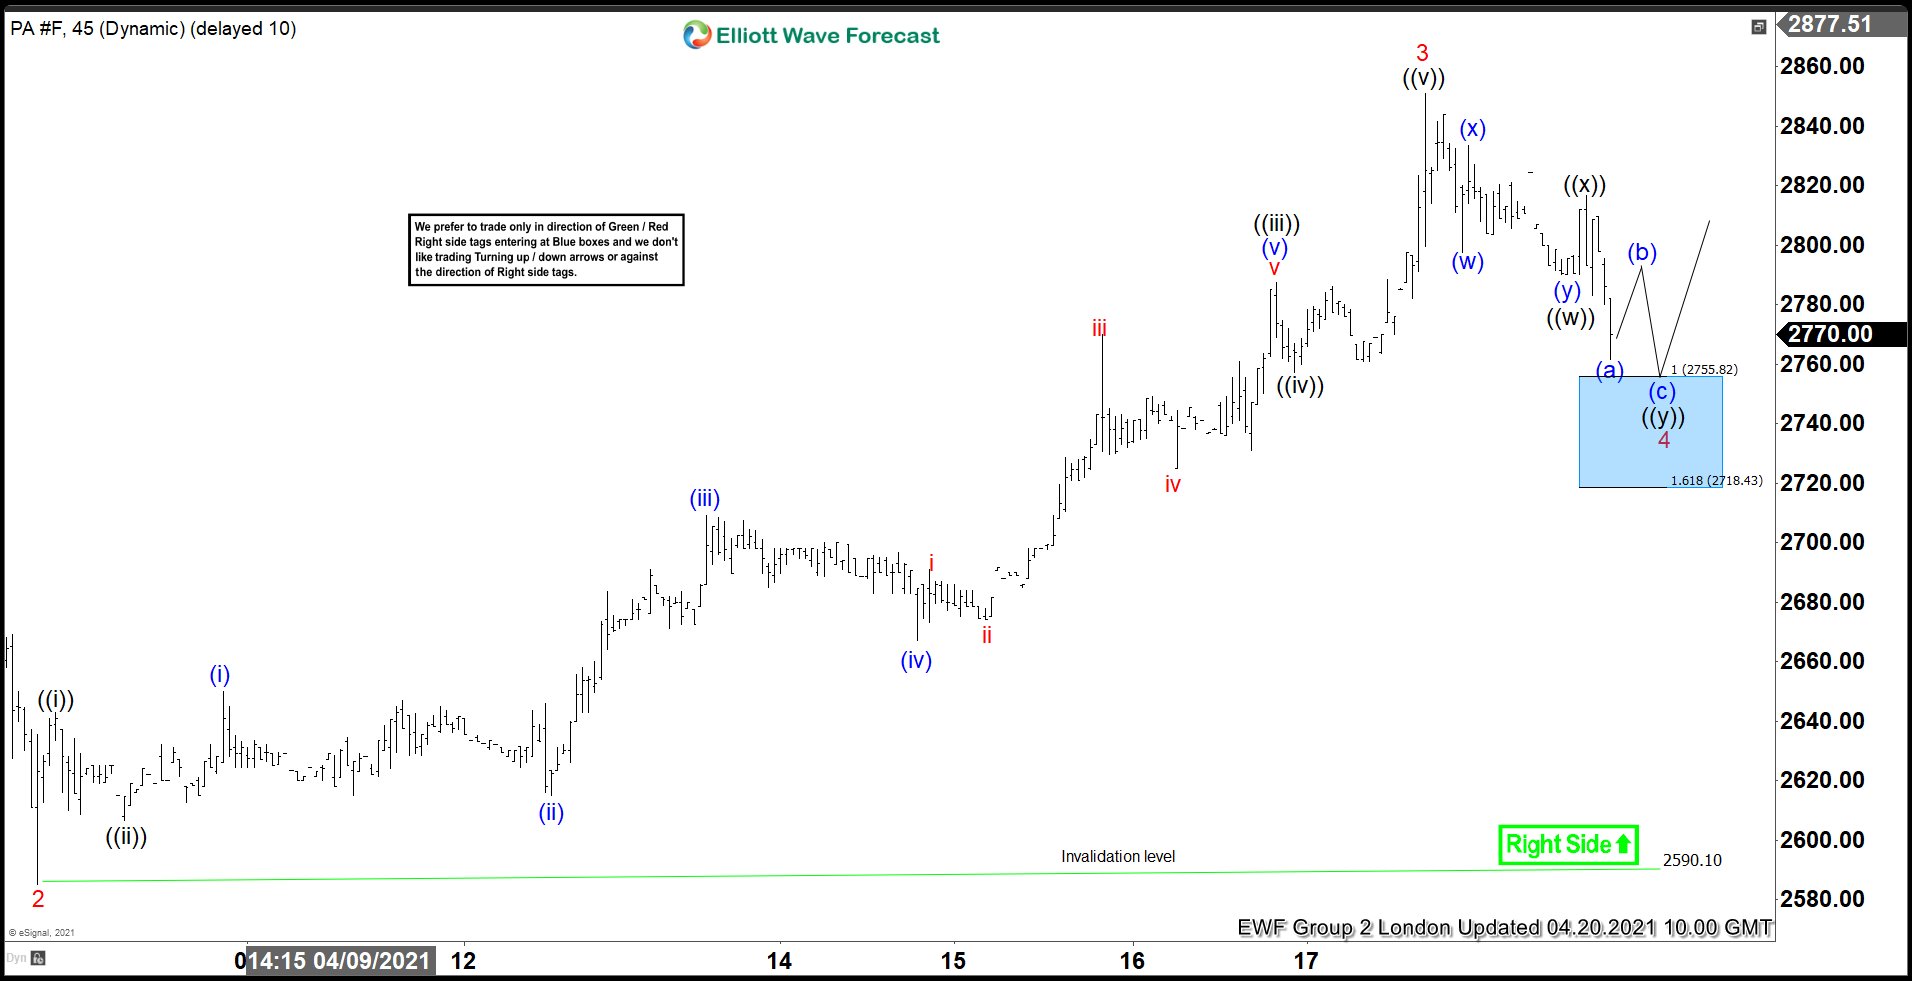
Palladium ($PA_F) Forecasting The Rally & Buying The Dips
Read MoreHello fellow traders. Palladium Futures ( $PA_F ) is another instrument that has given us nice trading opportunity lately . As our members know the commodity is showing impulsive bullish sequence. We recommended members to avoid selling the commodity and keep on buying the dips in 3,7,11 sequences when get chance. In this technical blog we’re going […]
-
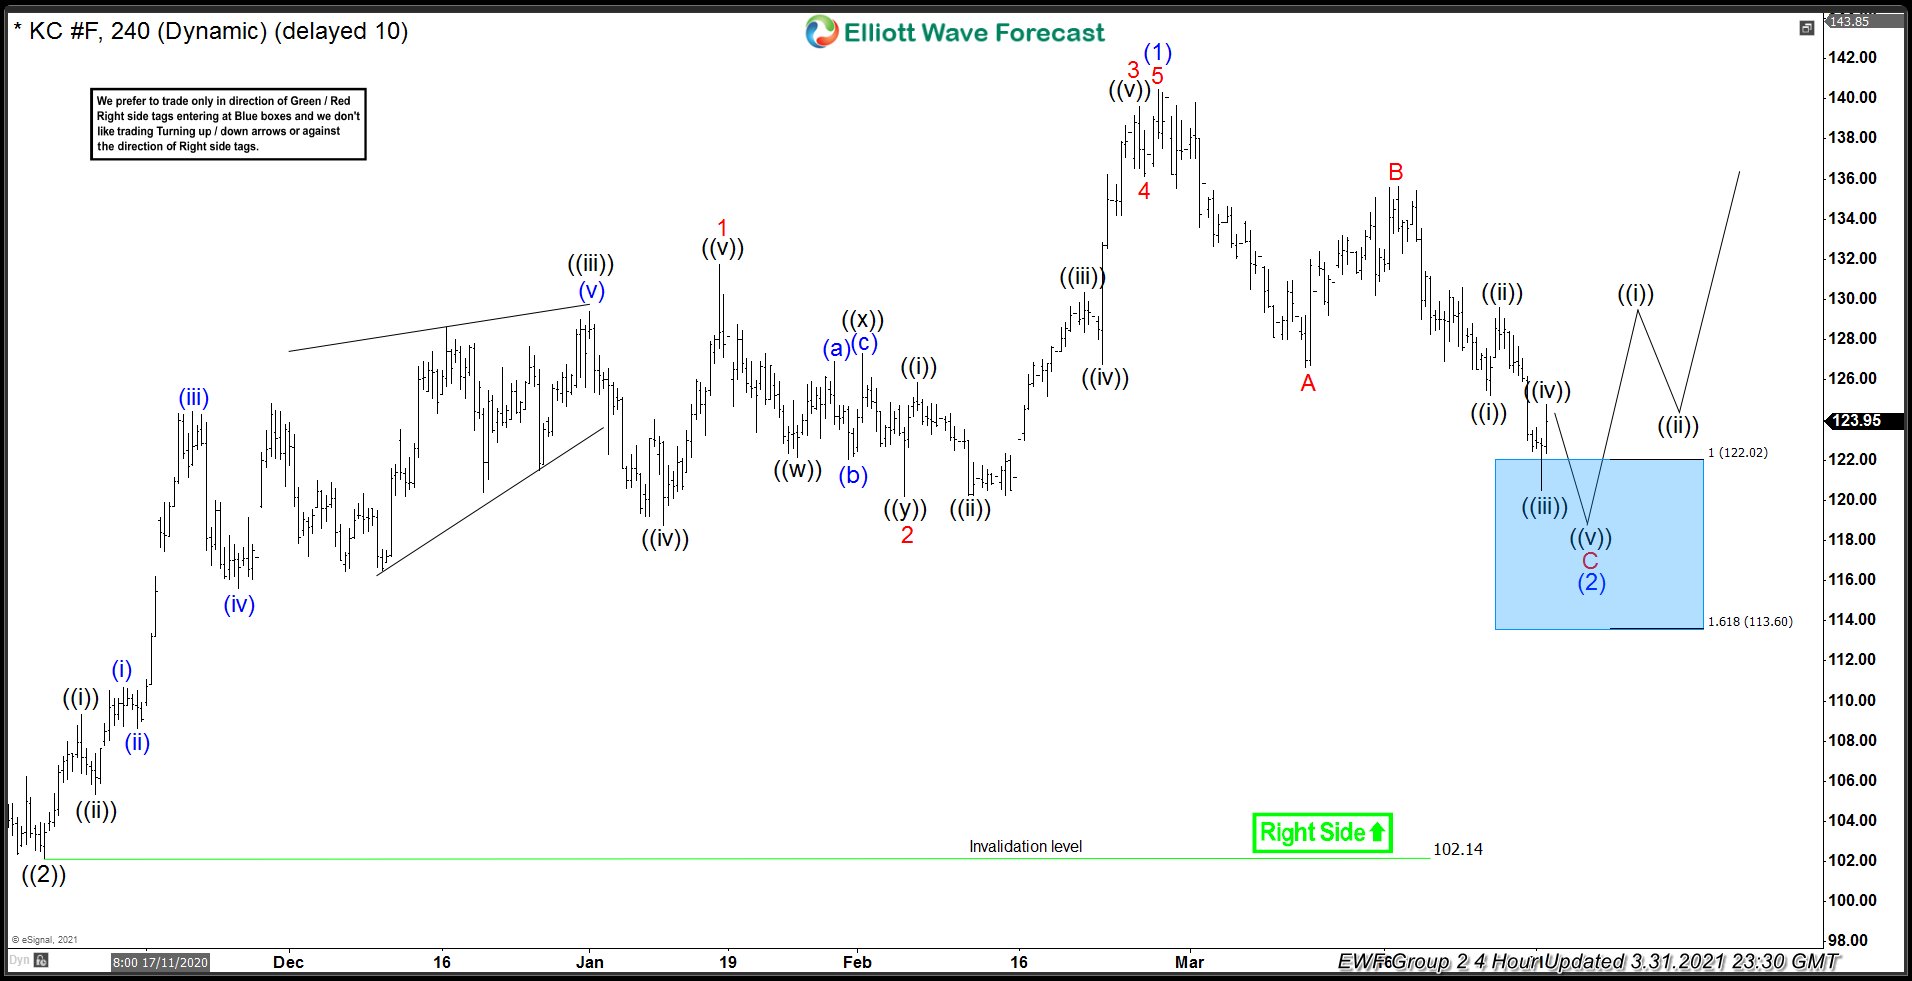
Coffee Bouncing From The Elliott Wave Blue Box Area
Read MoreIn this blog, we take a look at the past performance of 4hr Elliott Wave charts of Coffee, In which our members took advantage of the blue box areas.
-
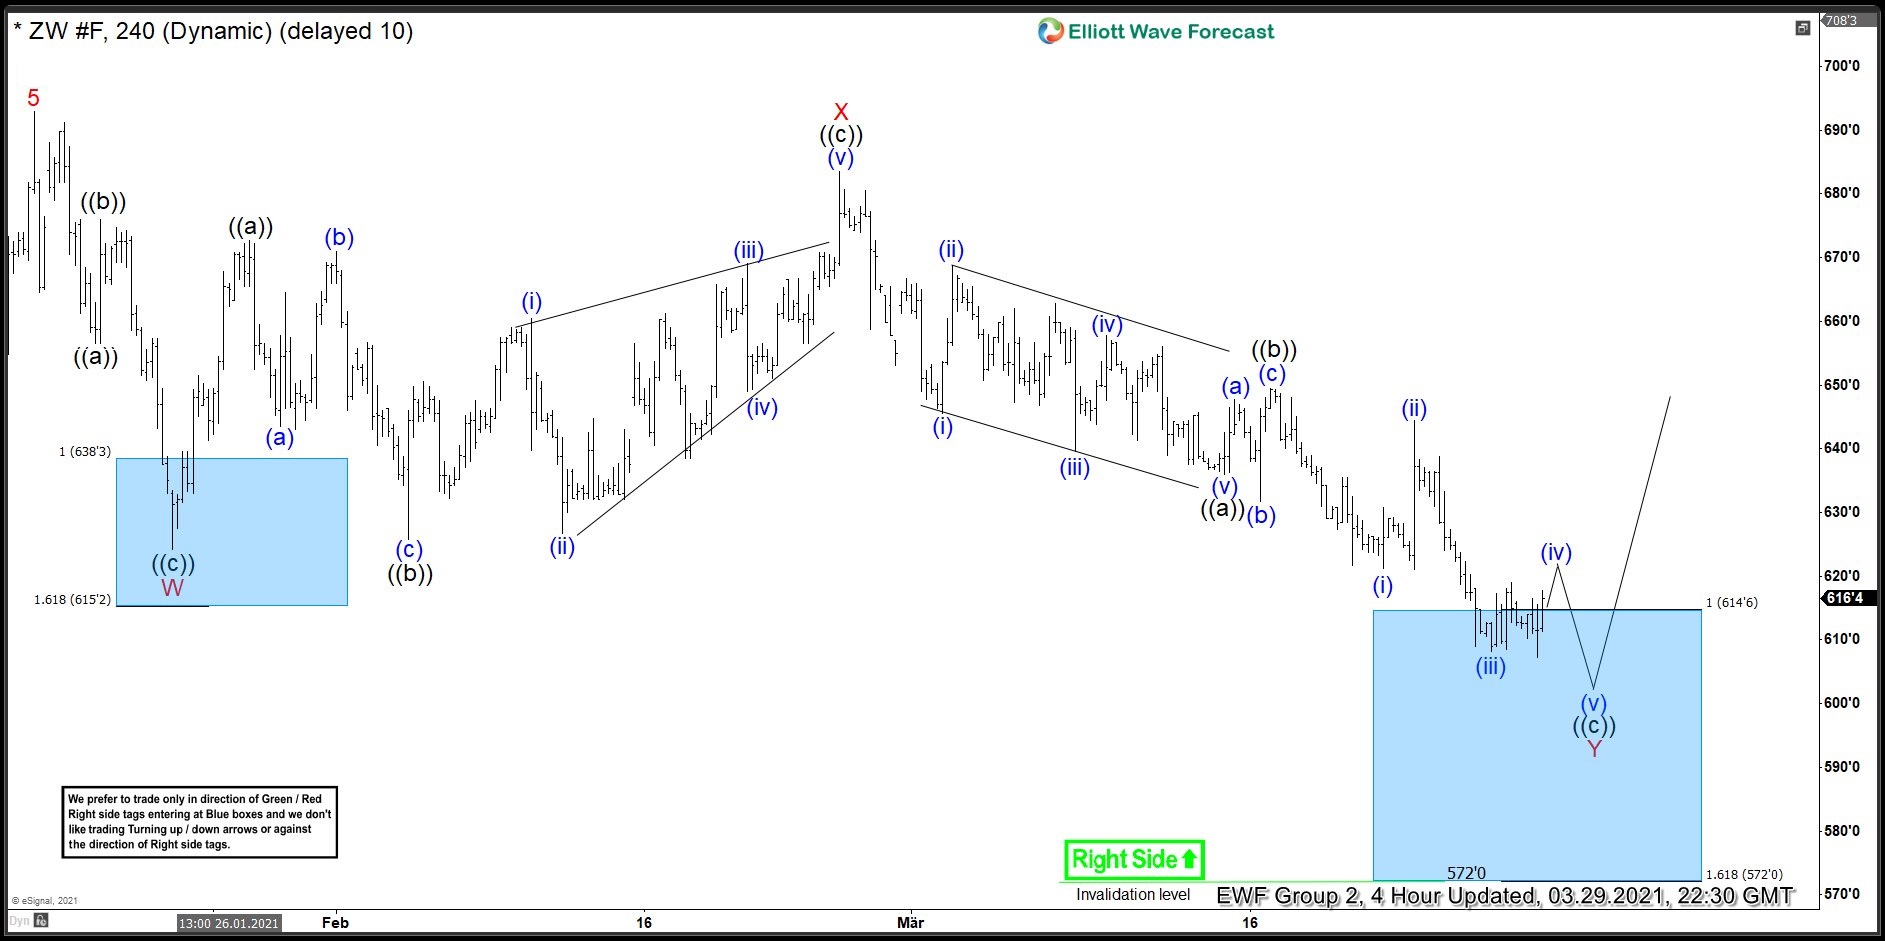
Dip In Wheat Offered a Good Elliott Wave Buying Opportunity
Read MoreIn this blog, we take a look at the past performance of 4hr Elliott Wave charts of Wheat, In which our members took advantage of the blue box areas.
-
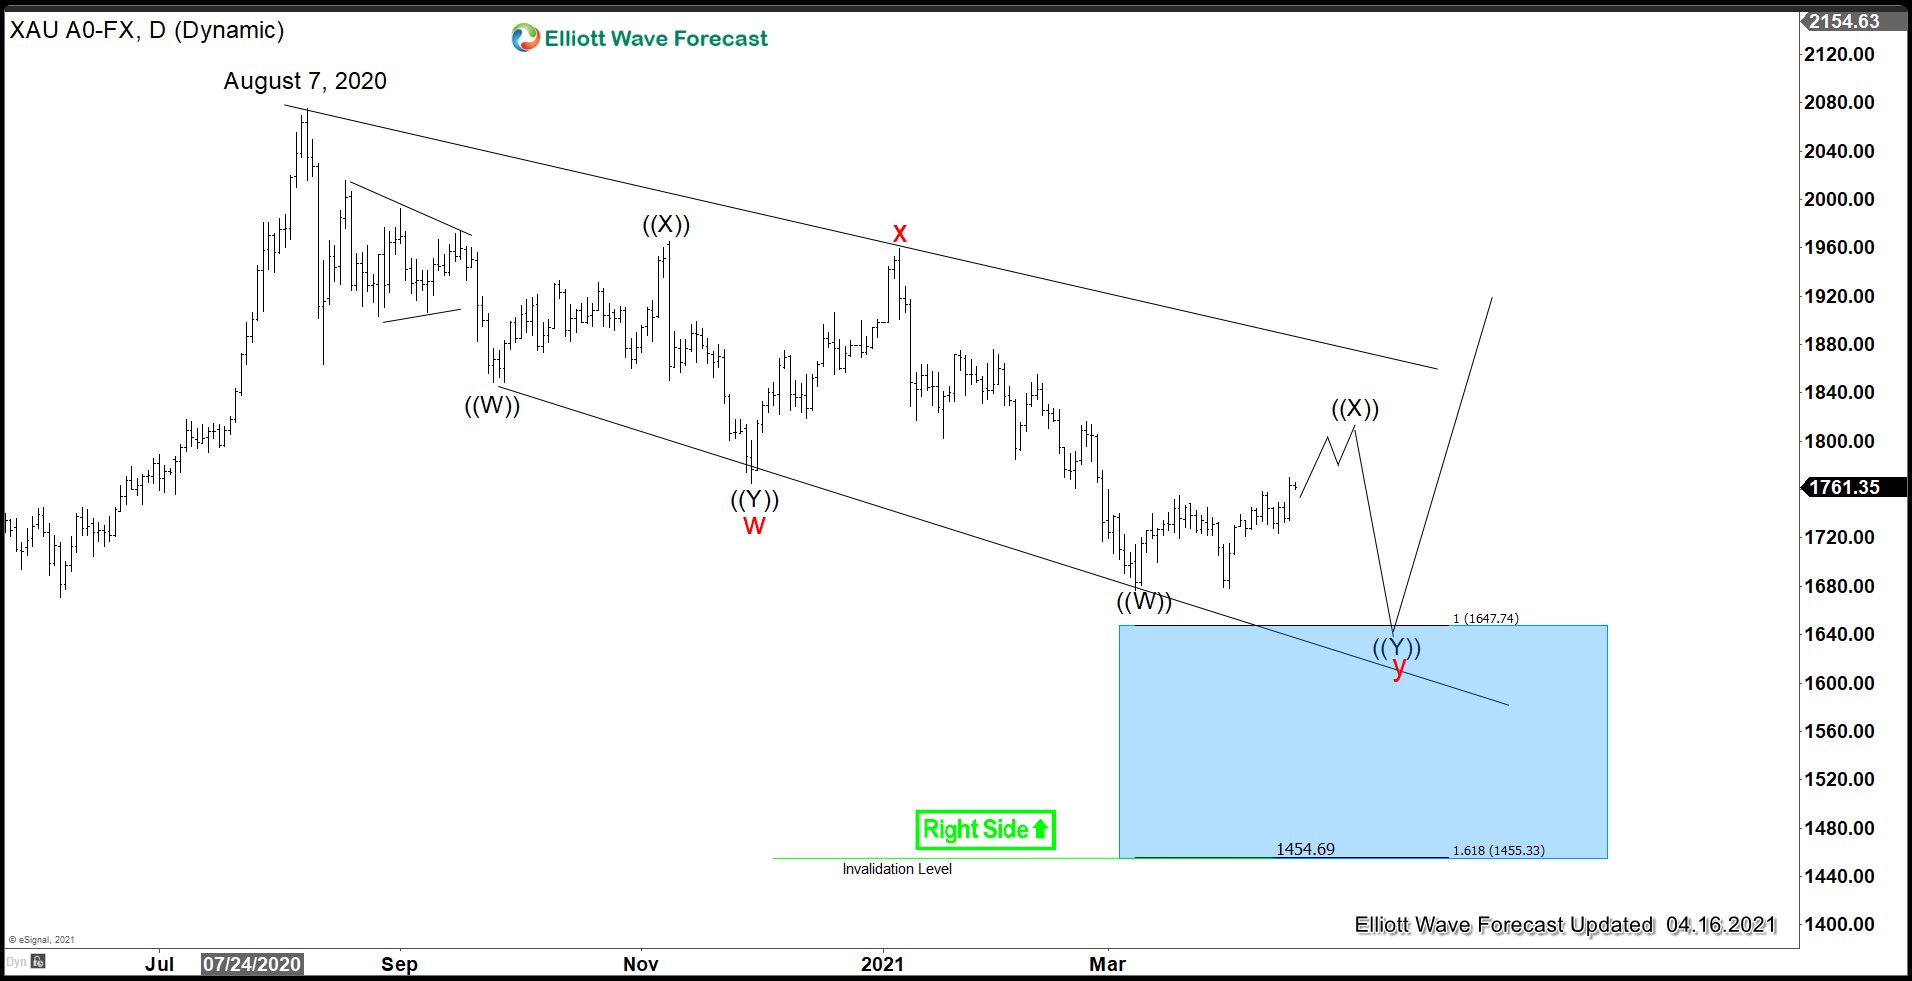
Has Gold Ended the 8 Months Correction?
Read MoreThere’s a lot of talk in Fintwit lately suggesting that precious metals may have ended the long 8 months correction and ready for the next glorious rally. In this article, I will attempt to answer the question whether Gold has ended correction or not using technical analysis. I will use Elliott Wave Theory and also […]
-
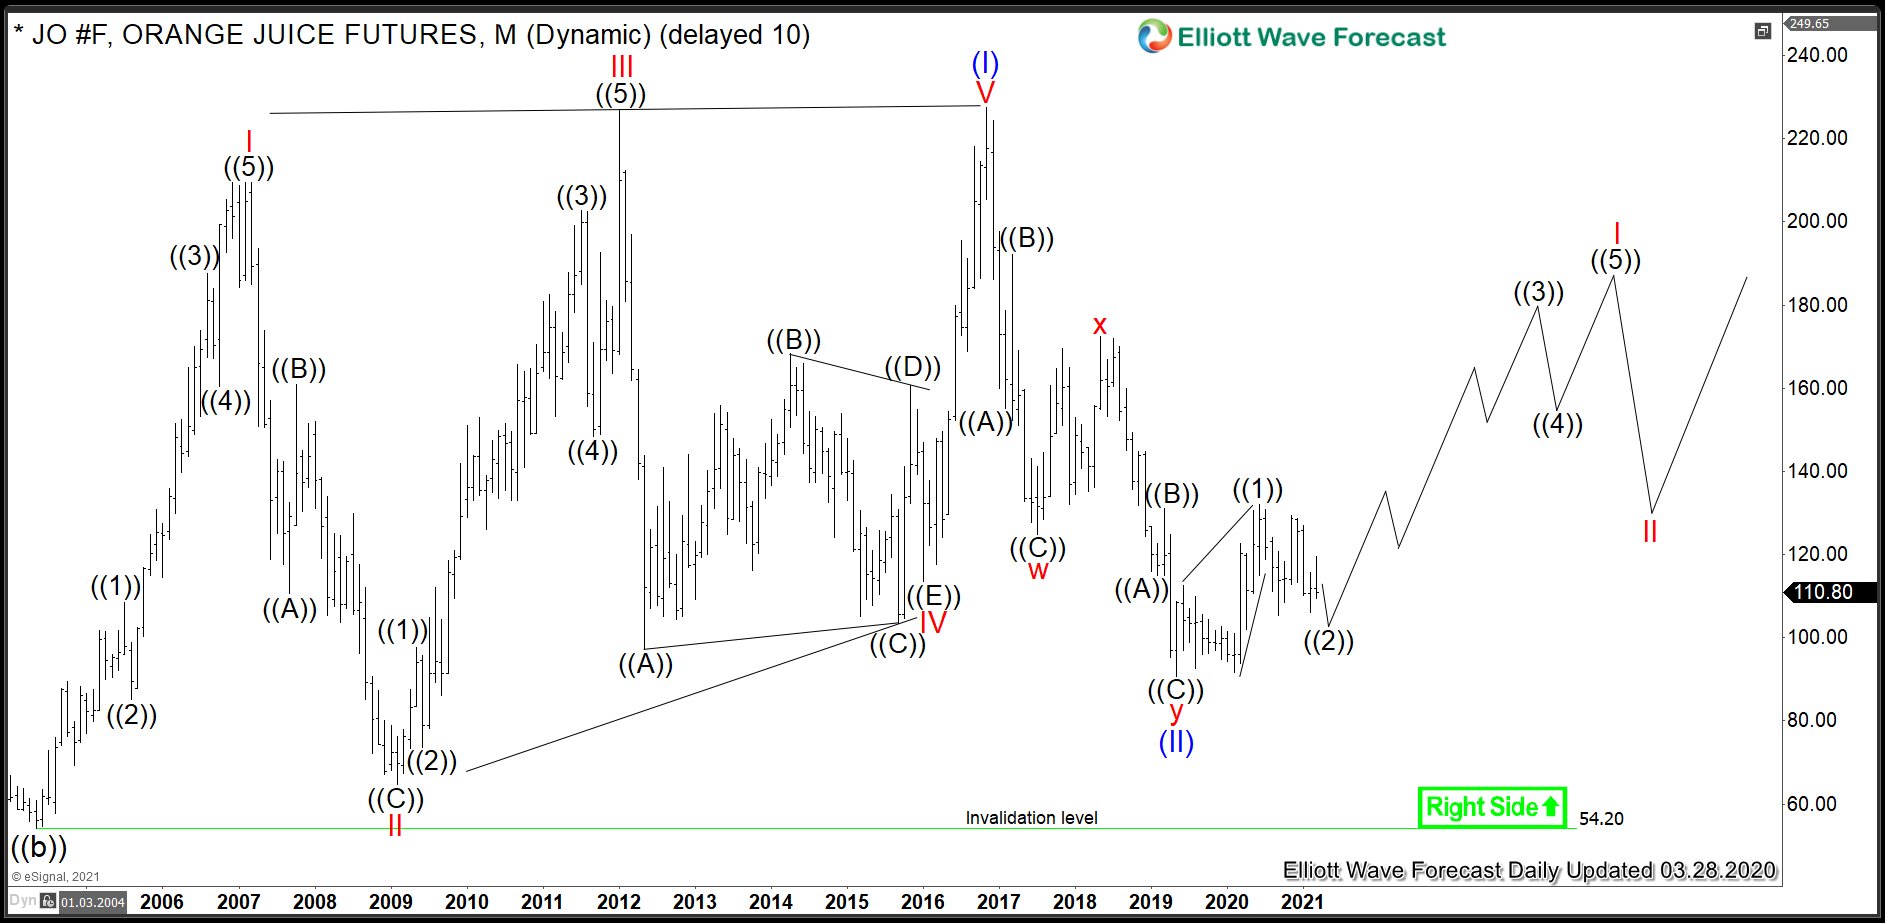
FCOJ: Frozen Concentrated Orange Juice Prices Should Climb Higher
Read MoreOrange Juice is a liquid extract of the orange tree fruit which is produced by squeezing or reaming oranges. It became a standard consumption good in the world but the juice is not everywhere the same. Indeed, there are important differences in the way how the companies produce it. Besides the most natural freshly squeezed […]