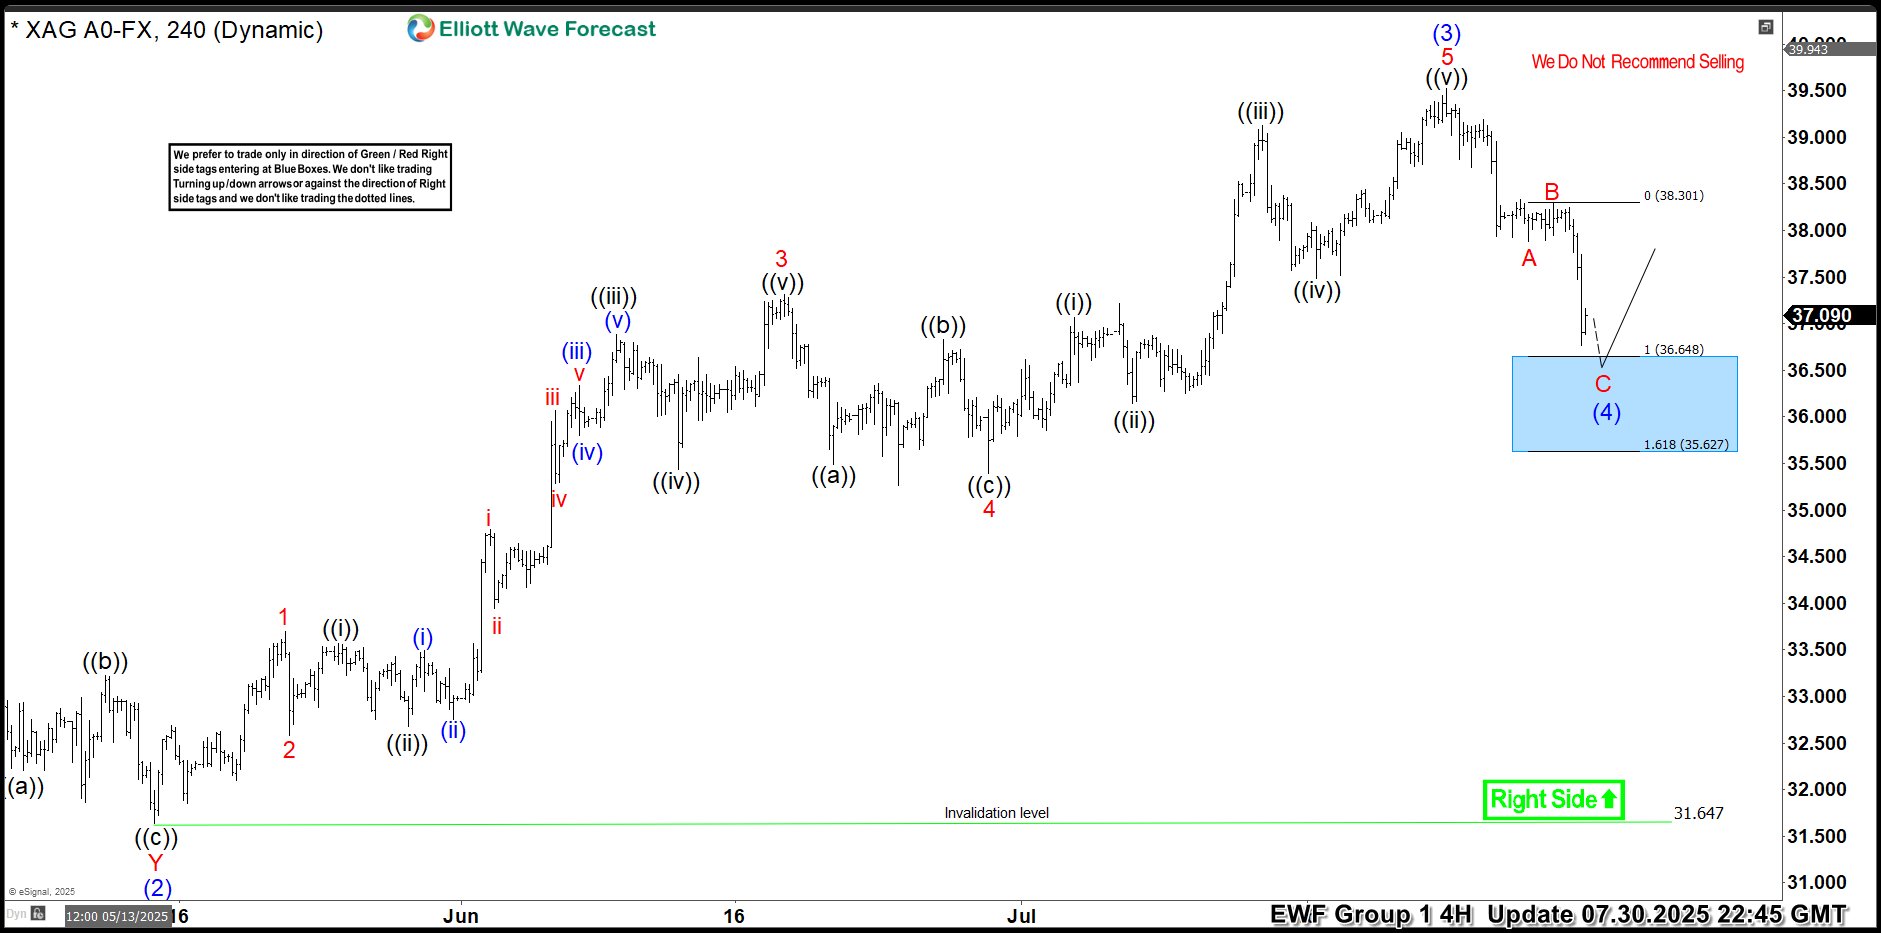

Hello traders. As our members know, we have had many profitable trading setups recently. In this technical article, we are going to talk about another Elliott Wave trading setup we got in Silver (XAGUSD). The commodity has completed its correction exactly at the Equal Legs zone, also known as the Blue Box Area. In this […]
-

Gold Elliott Wave Analysis
Read MoreIn today’s video we present Elliott Wave Analysis of the yellow metal which has reached 100% extension down from 1255 peak. Trend is down but it’s in an area where initiating new short positions is a dangerous proposition. Analysis based on market correlation allows for another push lower toward 1189 – 1184 area to end the […]
-

Gold Short-term Elliott Wave Analysis
Read MoreIn today’s video we present Elliott Wave Analysis of the yellow metal which has reached 100% extension down from 1255 peak. Trend is down but it’s in an area where initiating new short positions is a dangerous proposition. Analysis based on market correlation allows for another push lower toward 1189 – 1184 area to end the […]
-

OIL: Elliott Waves forecasting the path from 09.25.2014
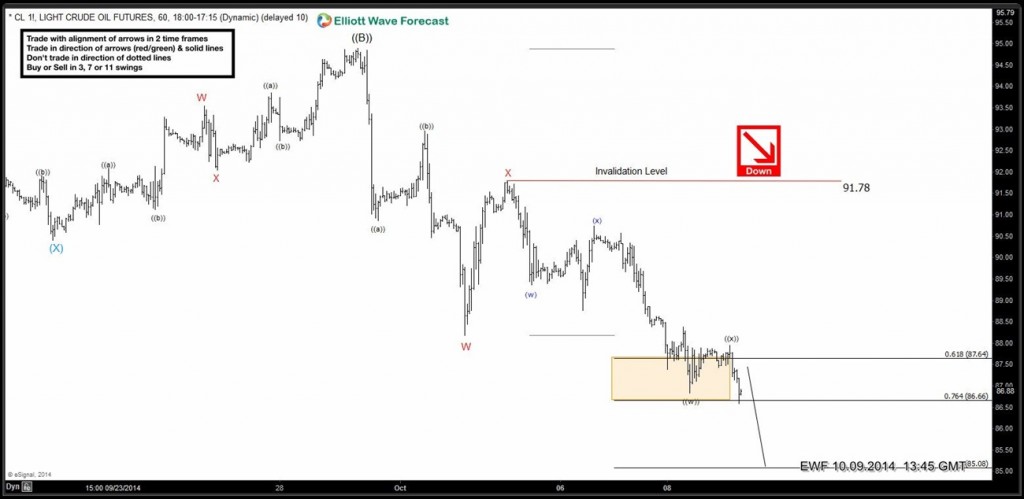
Read MoreAt the last days of September our Elliott Wave analysis for OIL suggested that we were doing double three corrective structure from the 89.56 low. The analysis was calling for more strength toward equal legs area (95.05-96.15) to complete wave ((B)) recovery, before further decline takes place in next bearish cycle – wave ((C)). Let’s […]
-

HG_F (Copper) 1 Hour Elliott Wave Analysis 11.6.2014
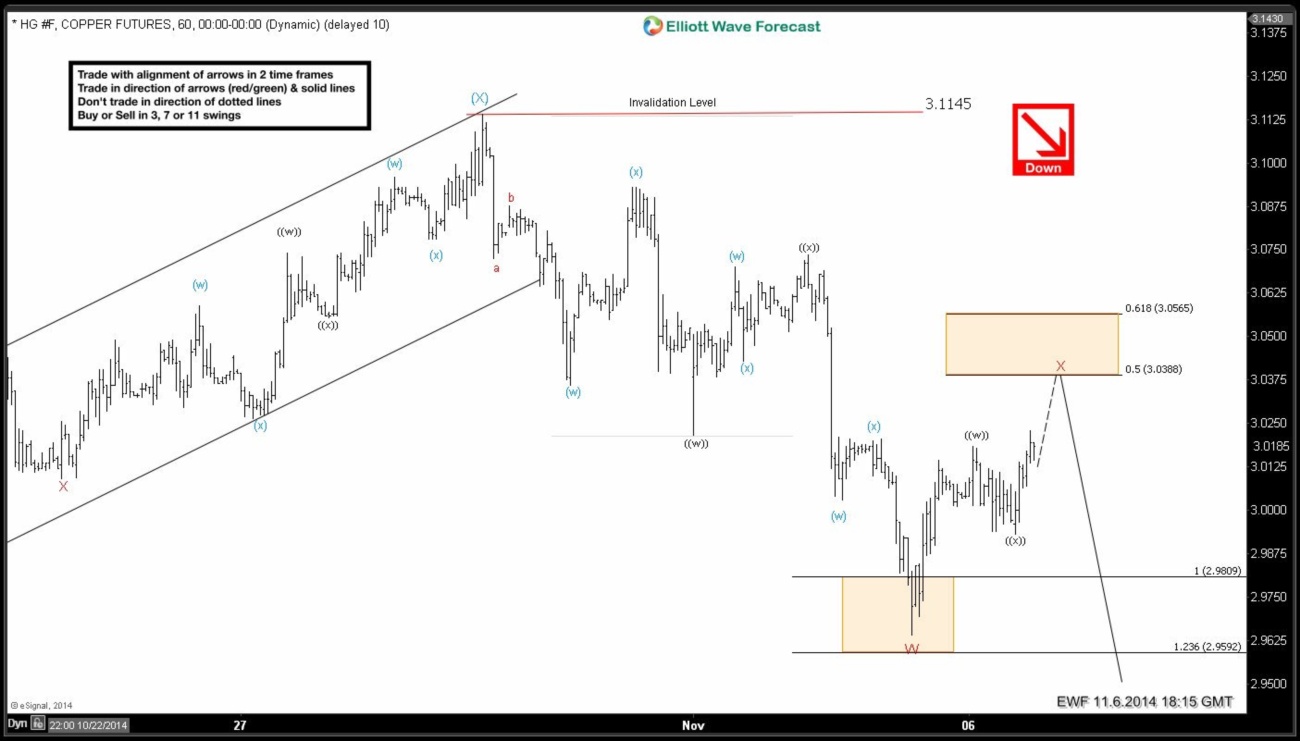
Read MoreCopper Futures (HG_F ) are bouncing after completing 7 swings down from 10.29 high but our preferred Elliott Wave count suggests down side is far from over and this is just a corrective bounce. Elliott Wave cycles remain bearish against 3.113 high and we view rallies as a selling opportunity in 3, 7 or 11 swings […]
-

$CL ! Crude Oil bounces to fail for more downside
Read MoreOil completed ((B)) @ 94.88. As per preferred Elliott Wave view, we have seen a 3 wave decline to 88.18 which completed wave W. Oil is now bouncing to correct the drop from 94.88 high. This bounce could test 50- 61.8 fib (91.54 – 92.34) area before decline resumes again. We don’t like buying Crude Oil […]
-

Crude Oil looking for equal legs lower
Read MorePreferred Elliott Wave view suggests Oil completed ((B)) @ 94.91. Cycle from 94.91 has concluded at 90.86 which completed wave (( a )) of the new down cycle. Oil has tested 50 back of the decline from 94.91 and has seen a sharp rejection, we believe wave (( b )) has completed at 92.94 and an […]