Elliott wave Forecast

Login
Start 14-Day Trial
  • Plans and Pricing
  • Education
    • 6 Educational Seminar Recordings
    • 4 Educational Seminar Recordings
    • EW Structures & Swing Sequence
    • Platinum Package
    • Trading Execution Seminar
    • New Elliott Wave, Correlation & Trading Execution
    • Premium Plus Package
    • Learn Elliott Wave
    • 1-1 Training
    • Premium Package
    • Trading Right Side using Elliott Wave Theory, Cycles and Sequences
    • Elliottwave, Market Dynamic and Correlations
  • Resources
    • Elliott Wave Theory
    • E-Books
      • Elliott Wave Book
      • Best Trading Strategies
      • eBook – Complete Beginners Guide to Forex Trading
      • Comprehensive Guide to Trading Stocks & ETFs
    • Position Size Calculator
    • Risk/Reward Calculator
    • News
    • Newsletter
    • Crypto-Currencies
  • Free Articles
  • About Us
  • Performance

Hello everyone! In today’s article, we’ll examine the recent performance of Advanced Micro Devices, Inc $AMD through the lens of Elliott Wave Theory. We’ll review how the decline from the December 05, 2024, peak unfolded as a 5-wave impulse and discuss our forecast for the next move. Let’s dive into the structure and expectations for this stock.

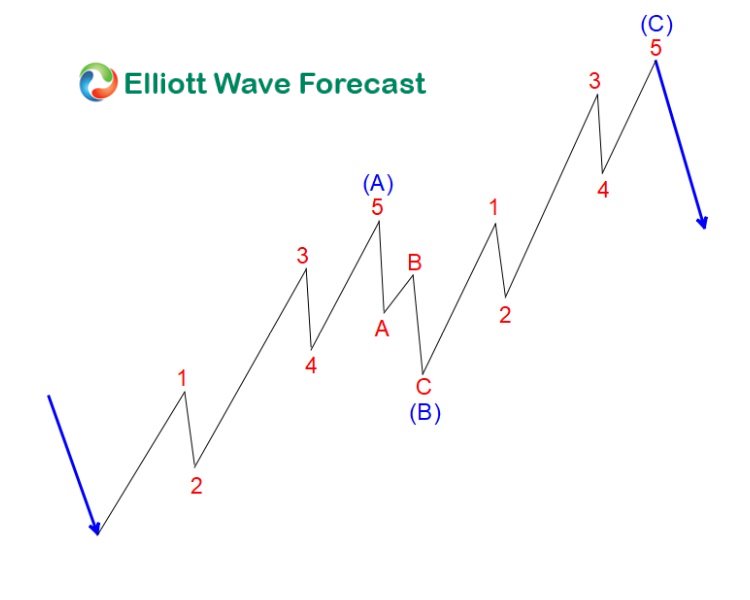
Zig-Zag ABC correction

$AMD

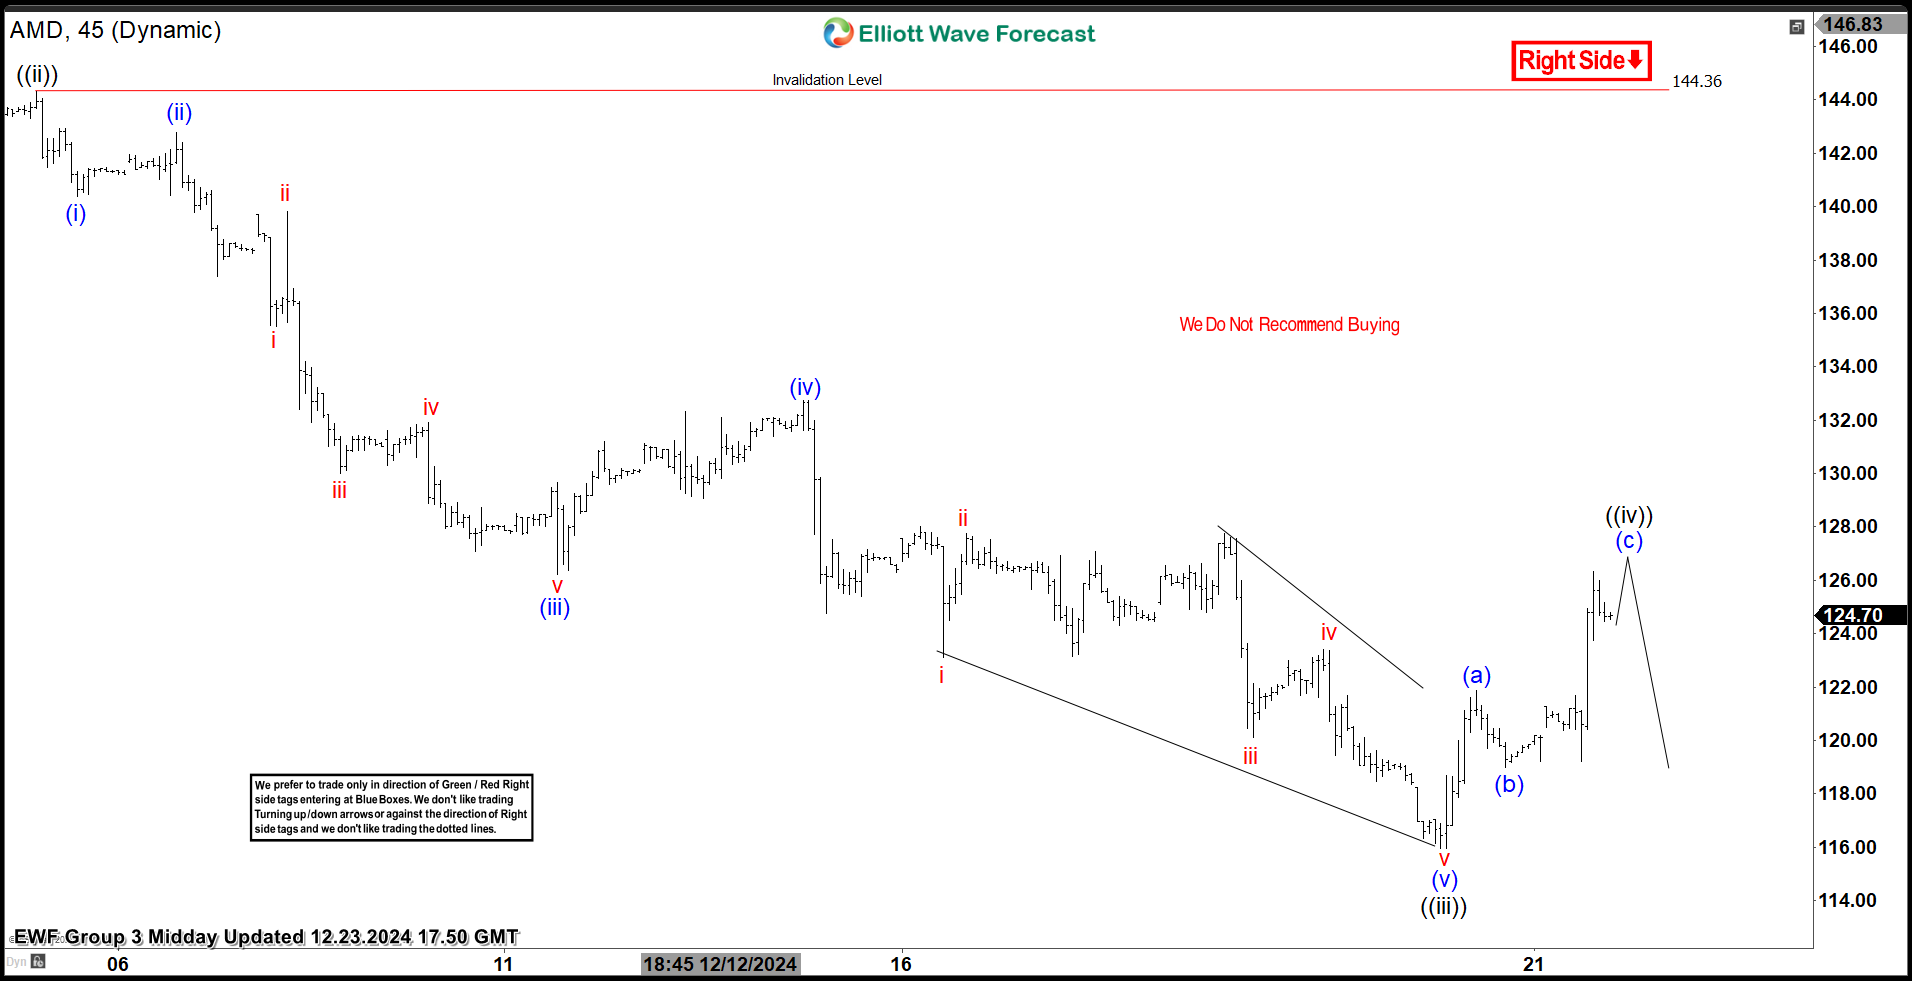
 $AMD 1H Elliott Wave Chart 12.23.2024:

$AMD

In the 1-hour Elliott Wave count from December 23, 2024, we see that $AMD completed a 5-wave impulsive cycle beginning on December 05, 2024, and ending on December 20, 2024, at the black ((iii)). As expected, this initial wave prompted a bounce. We anticipated this bounce to find sellers after unfolding in 3 swings.

This setup aligns with a typical Elliott Wave correction pattern (ABC), where the market pauses briefly before resuming the main trend.

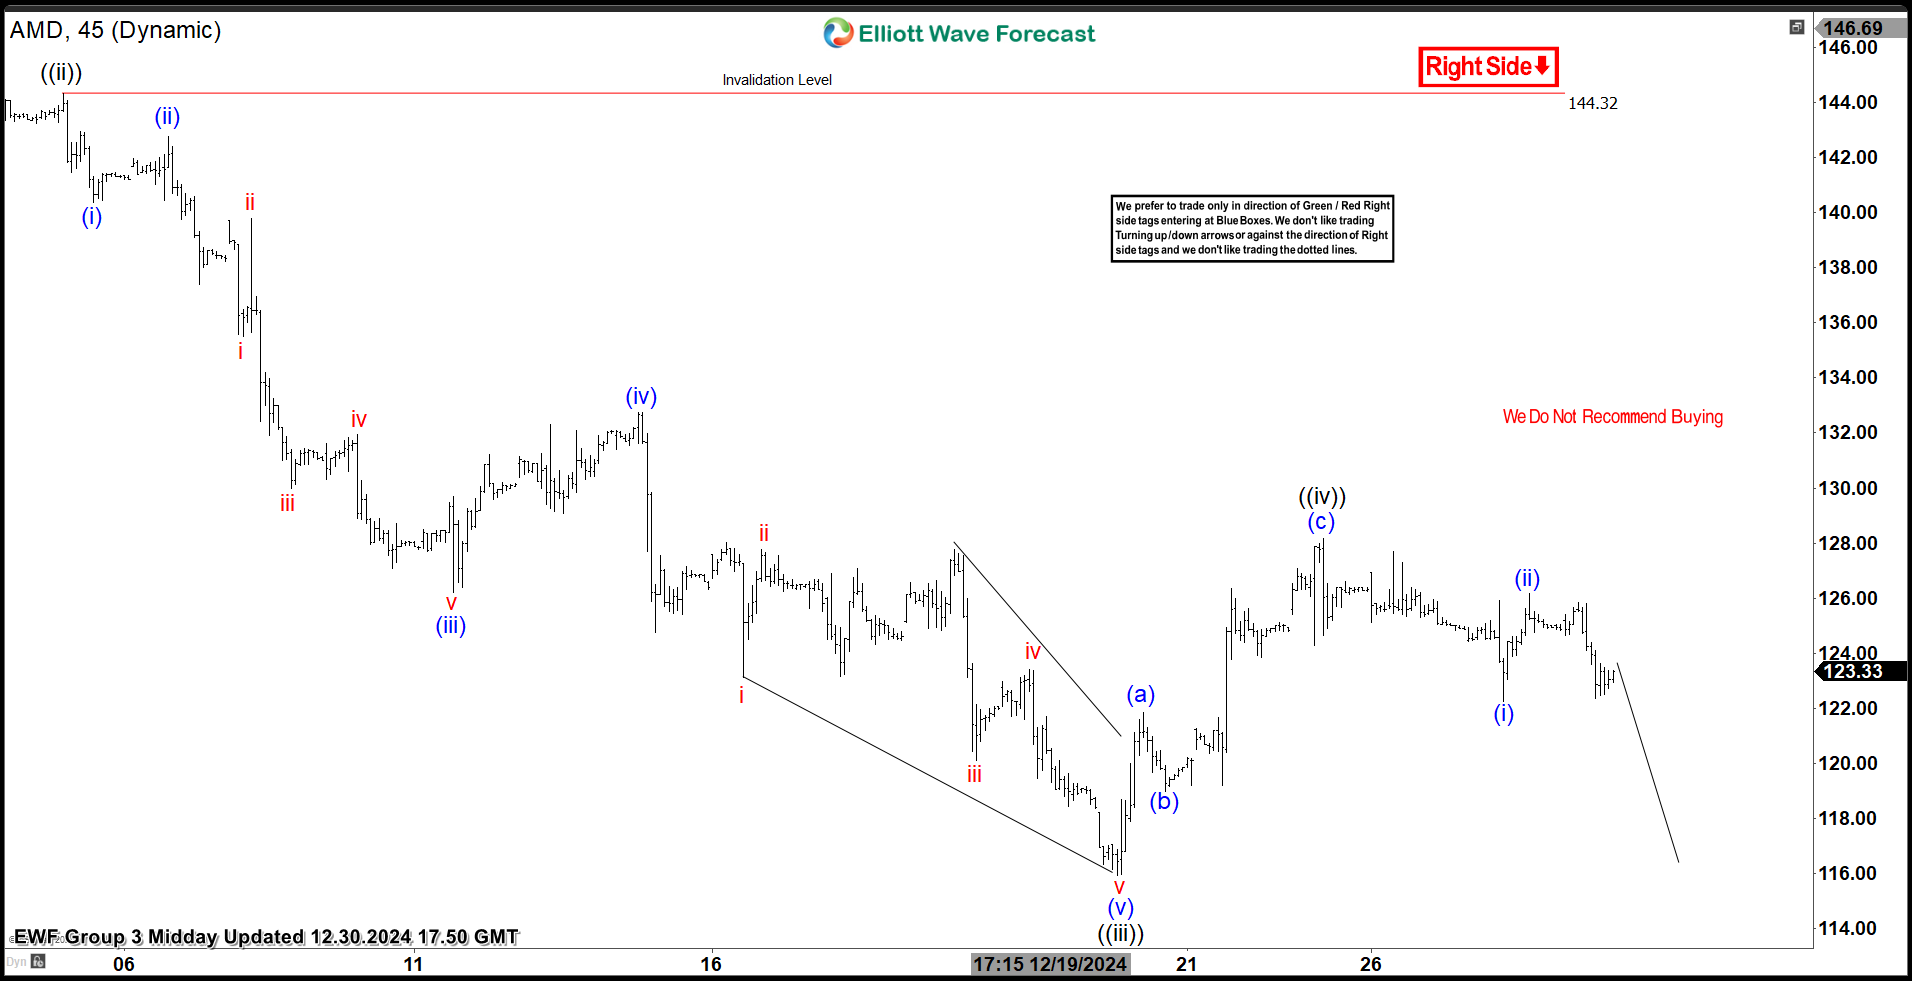
$AMD 1H Elliott Wave Chart 12.30.2024:

$AMD

The most recent update, from December 30, 2024, shows that $AMD reacted as predicted. After the bounce from the recent low, the stock found sellers after 3 swings up, leading to a decline.

What’s Next for $AMD?

With the current decline, $AMD sellers are in control. Based on the Elliott Wave structure, we expect the stock to continue its downward trajectory, targeting the $113 – $108 range before another potential bounce. Therefore, it is essential to keep monitoring this zone as we approach it.

Conclusion

In conclusion, our Elliott Wave analysis of Advanced Micro Devices, Inc $AMD suggests that it should remain weak in the short term. Therefore, sellers should monitor the $113 – $108 zone as the next target, keeping an eye out for any corrective bounces. By using Elliott Wave Theory, we can identify potential selling areas and enhance risk management in volatile markets.

Elliott Wave Forecast

We cover 78 instruments, but not every chart is a trading recommendation. We present Official Trading Recommendations in the Live Trading Room. If not a member yet,  Sign Up for 14 days Trial now and get access to new trading opportunities.

Welcome to Elliott Wave Forecast!

  • My Account
  • Elliott Wave Cycles
  • Educational Videos
  • EWF Quarterly Forecast
  • EWF Yearly Forecast
  • Trading Execution Module
  • Educational Seminars
    • Learn Elliott Wave
    • Wave Structures & Sequences
    • Trading Execution Seminar
    • New Elliott Wave, Correlation and Execution
    • Trading Right Side using Elliott wave Theory, Cycles and Sequences
    • Elliottwave, Market Dynamic and Correlations
  • Educational Packages
    • Platinum Educational package
    • Premium Plus Educational Package
    • Premium Educational Package
    • Premium Educational Package 2
    • Premium Educational Package 3
    • Premium Educational Package 4
  • Ultimate Elliott Wave Practical Workshop
  • Get Group 1
  • Get Group 2
  • Get Group 3

Logged in as:

Logout
Leading Elliott Wave technical analysis firm covering all major asset groups.

Forex

  • EUR/USD Forecast
  • GBP/USD Forecast
  • EUR/GBP Forecast
  • AUD/USD Forecast
  • GBP/JPY Forecast
  • EUR/JPY Forecast
  • USD/CHF Forecast

Stock Market

  • NASDAQ Forecast
  • DOW JONES Forecast
  • FTSE INDEX Forecast
  • DAX INDEX Forecast
  • NIFTY 50 Forecast
  • IBEX INDEX Forecast
  • S&P500 (SPX) Forecast

Commodities

  • Silver Forecast
  • Gold Forecast
  • Palladium Forecast
  • Copper Forecast
  • OIL Forecast
  • Natural Gas Forecast
  • Platinum Forecast

Resources

  • Crypto-Currencies
  • Elliott Wave Videos
  • FAQs
  • Forex Signals
  • Commodity Signals
  • Elliott Wave Theory
  • Free Articles
  • Position Size Calculator
  • News

Education

  • Free eBook
  • Educational Products
  • About Us
  • Best Trading Strategies

Subscriptions

  • Silver Plan
  • Gold Plan
  • Platinum Plan
  • Diamond Plan

Quick Links

  • Contact Us
  • Terms & Conditions
  • Privacy Policy
  • Disclaimer
  • FAQs
  • Jobs Opportunities
  • Testimonials
  • Cancellation / Refund Policy
  • Consent Preferences

Get in Touch

Contact Us

EME Processing & Consulting LLC. 7090 NW 173 Dr. Miami FL, 33015, USA

support@elliottwave-forecast.com

Copyright © 2025 All Rights Reserved

safe icon
Disclaimer: Futures, options, stocks, ETFs and over the counter foreign exchange products may involve substantial risk and may not be suitable for all investors. Leverage can work against you as well as for you. You should therefore carefully consider your investment experience as well as financial condition before deciding if trading is suitable for you.